What's New
Content Chimera is a tool to communicate and engage with stakeholders about their digital presence, dynamically answer content questions, and make content decisions. It does this with interactive charting, a rules engine, merging from sources such as Google Analytics, deduplicating URLs, multi-level analysis for complex/global digital presences, automated multi-step processing, near duplicate probabilistic analysis, on-the-go analysis across devices, and team support. Content Chimera imports from source systems such as CMSes or crawlers (or it can do the crawl itself, with features such as "circuit breakers" for very large crawls).See features.
July 9, 2024 — A Long-Overdue Update
We have been remiss in updating What's New with Content Chimera! Mostly we have been doing some prototyping (see below), but here are some of the most interesting improvements that have been rolled out:
- Simplified dispositions page.A sortable dispositions page as well as a "read-only" mode that's simplified for a wider audience than those working in Chimera.
- Sitemap following. Pull the XML sitemap and crawl those URLs as well (don't solely crawl URLs found on HTML pages)
- Big Number visualization, which is, just that, the ability to display a big number as a visualization (and in Chimera interactive reports). In addition, you can now embed these numbers as straight text within reports. This means that even within your text the numbers will change as your data changes over time (we don't have a screenshot of that sicne there isn't much to show -- it's just a number like "7" in a sentence like "there are 7 subdomains in this analysis" that would update to "8" if that underlying metric changed). The below is an example of four big numbers in a summary section at the top of a report.

As usual, behind the scenes we are prototyping and testing a variety of options that may turn into public features, like:
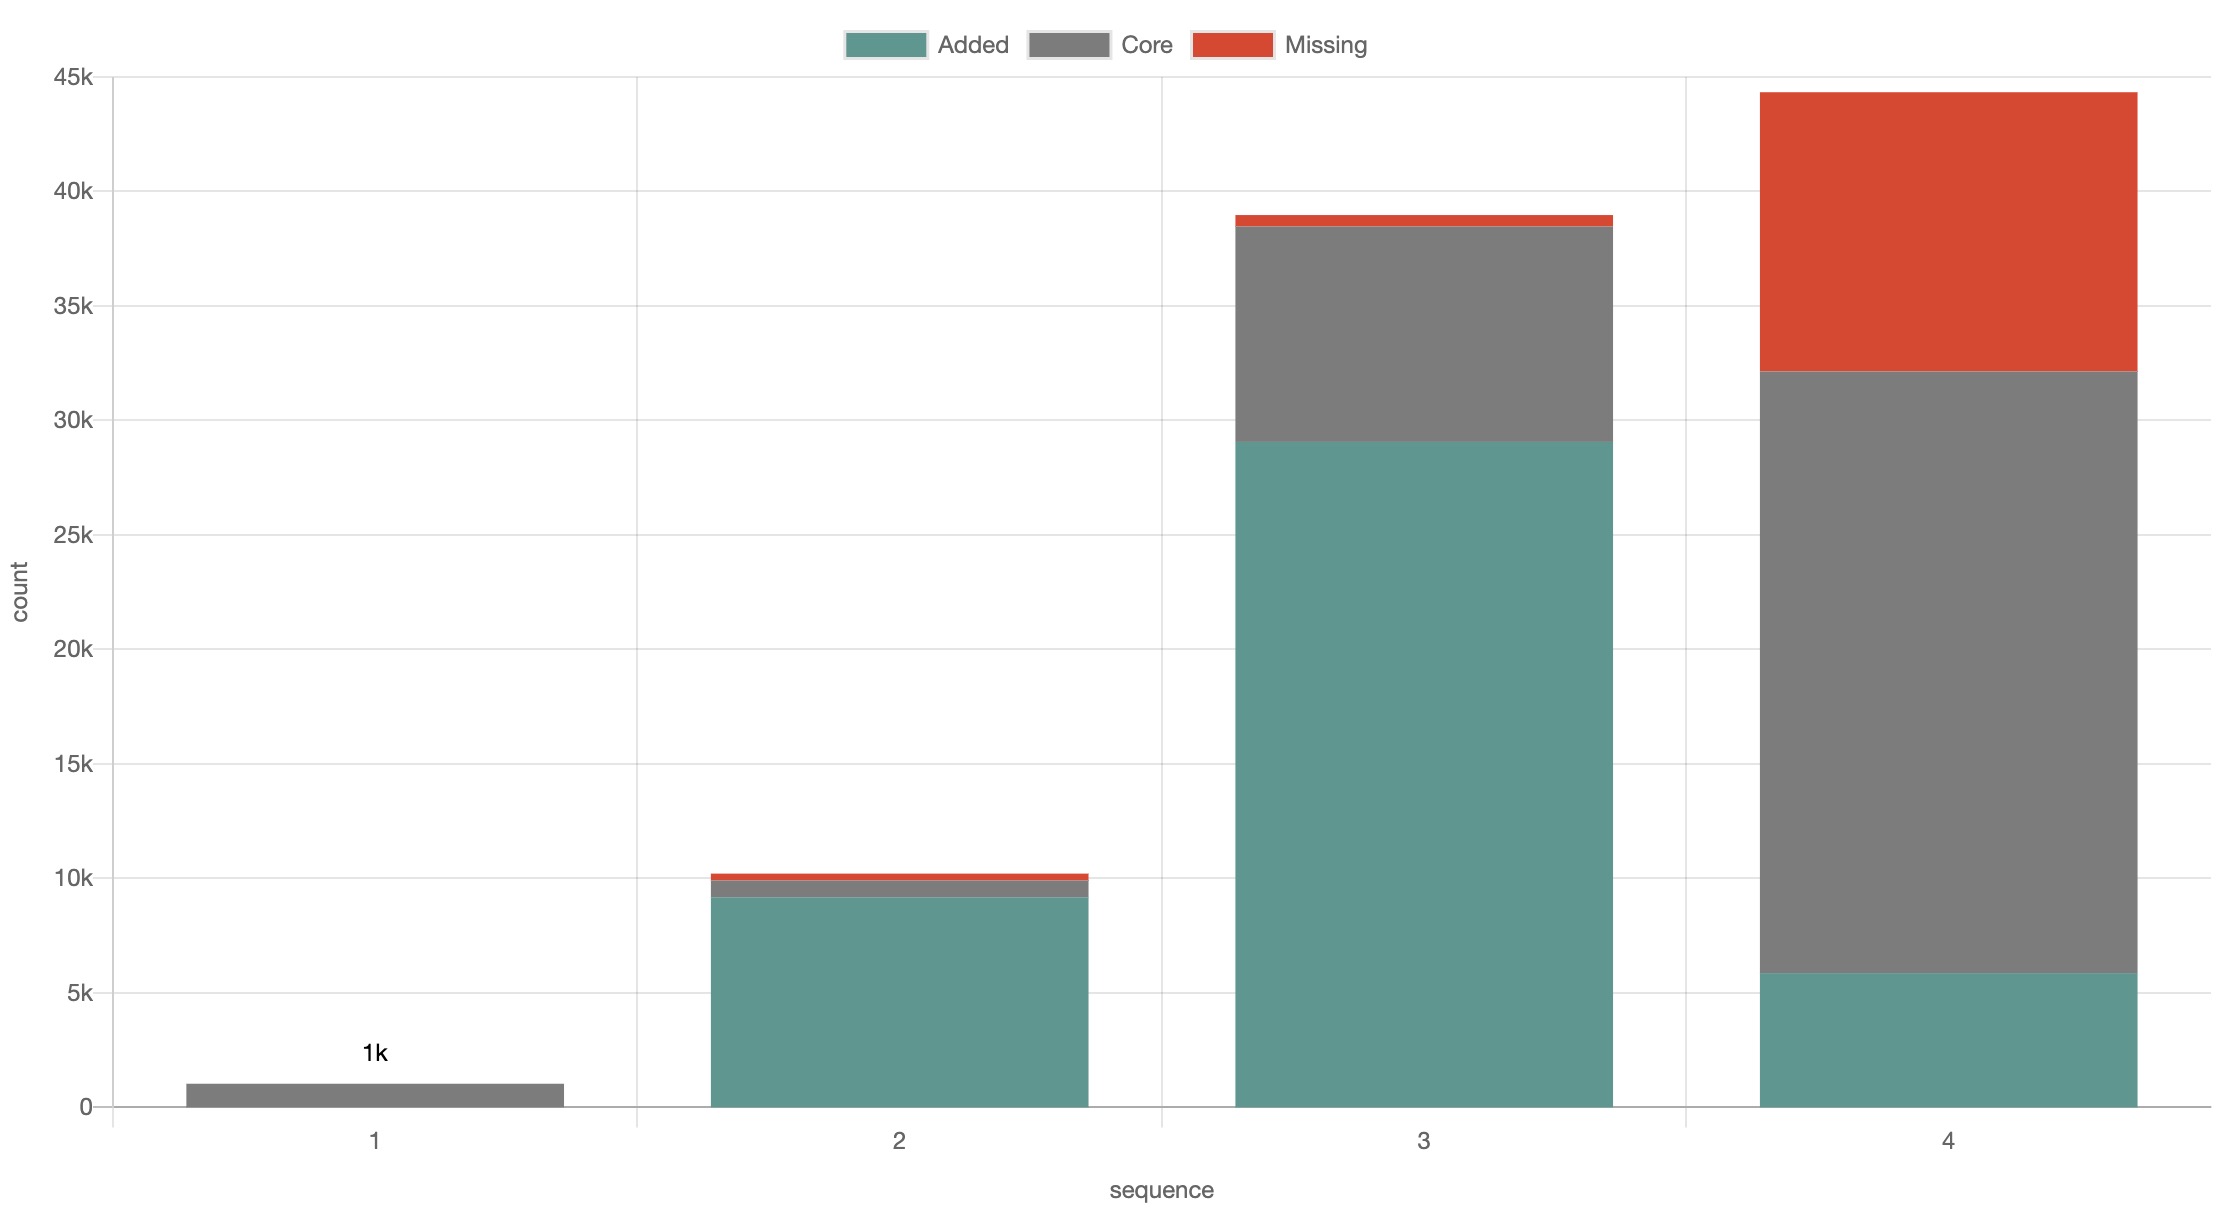
- Comparing assets over time. There is already the ability to do over-time charting, but this new feature that we are developing compares pairwise content item to content item. In other words, we already have the feature to see the volume of content and how that volume changes (chartable by whatever field is in Chimera), but the new capability highlights which content was the same, what content was added, and what was deleted (in the live chart, you can click through to see the actual URLs or even filter on a particular status). Readiness level: just need to develop the UI.
- Using generative AI for categorization. We started developing the ability to send content from Chimera to/from LLMs (in particular, Claude and ChatGPT). This is still quite speculative since we haven't yet gotten reliable results. Over the years we have played with other models and categorization techniques that were not very useful either. Readiness: not sure, since we haven't made a breakthrough on consistent categorization.
- An attempt at determining a rough "template" of each page (so, for example, you could group pages by similar templates). Right now it is overly-granular (it is more likely to say two pages have different templates even when a human would probably say they are the same). Readiness: not sure, since we need more investigation to determine if the results are useful.
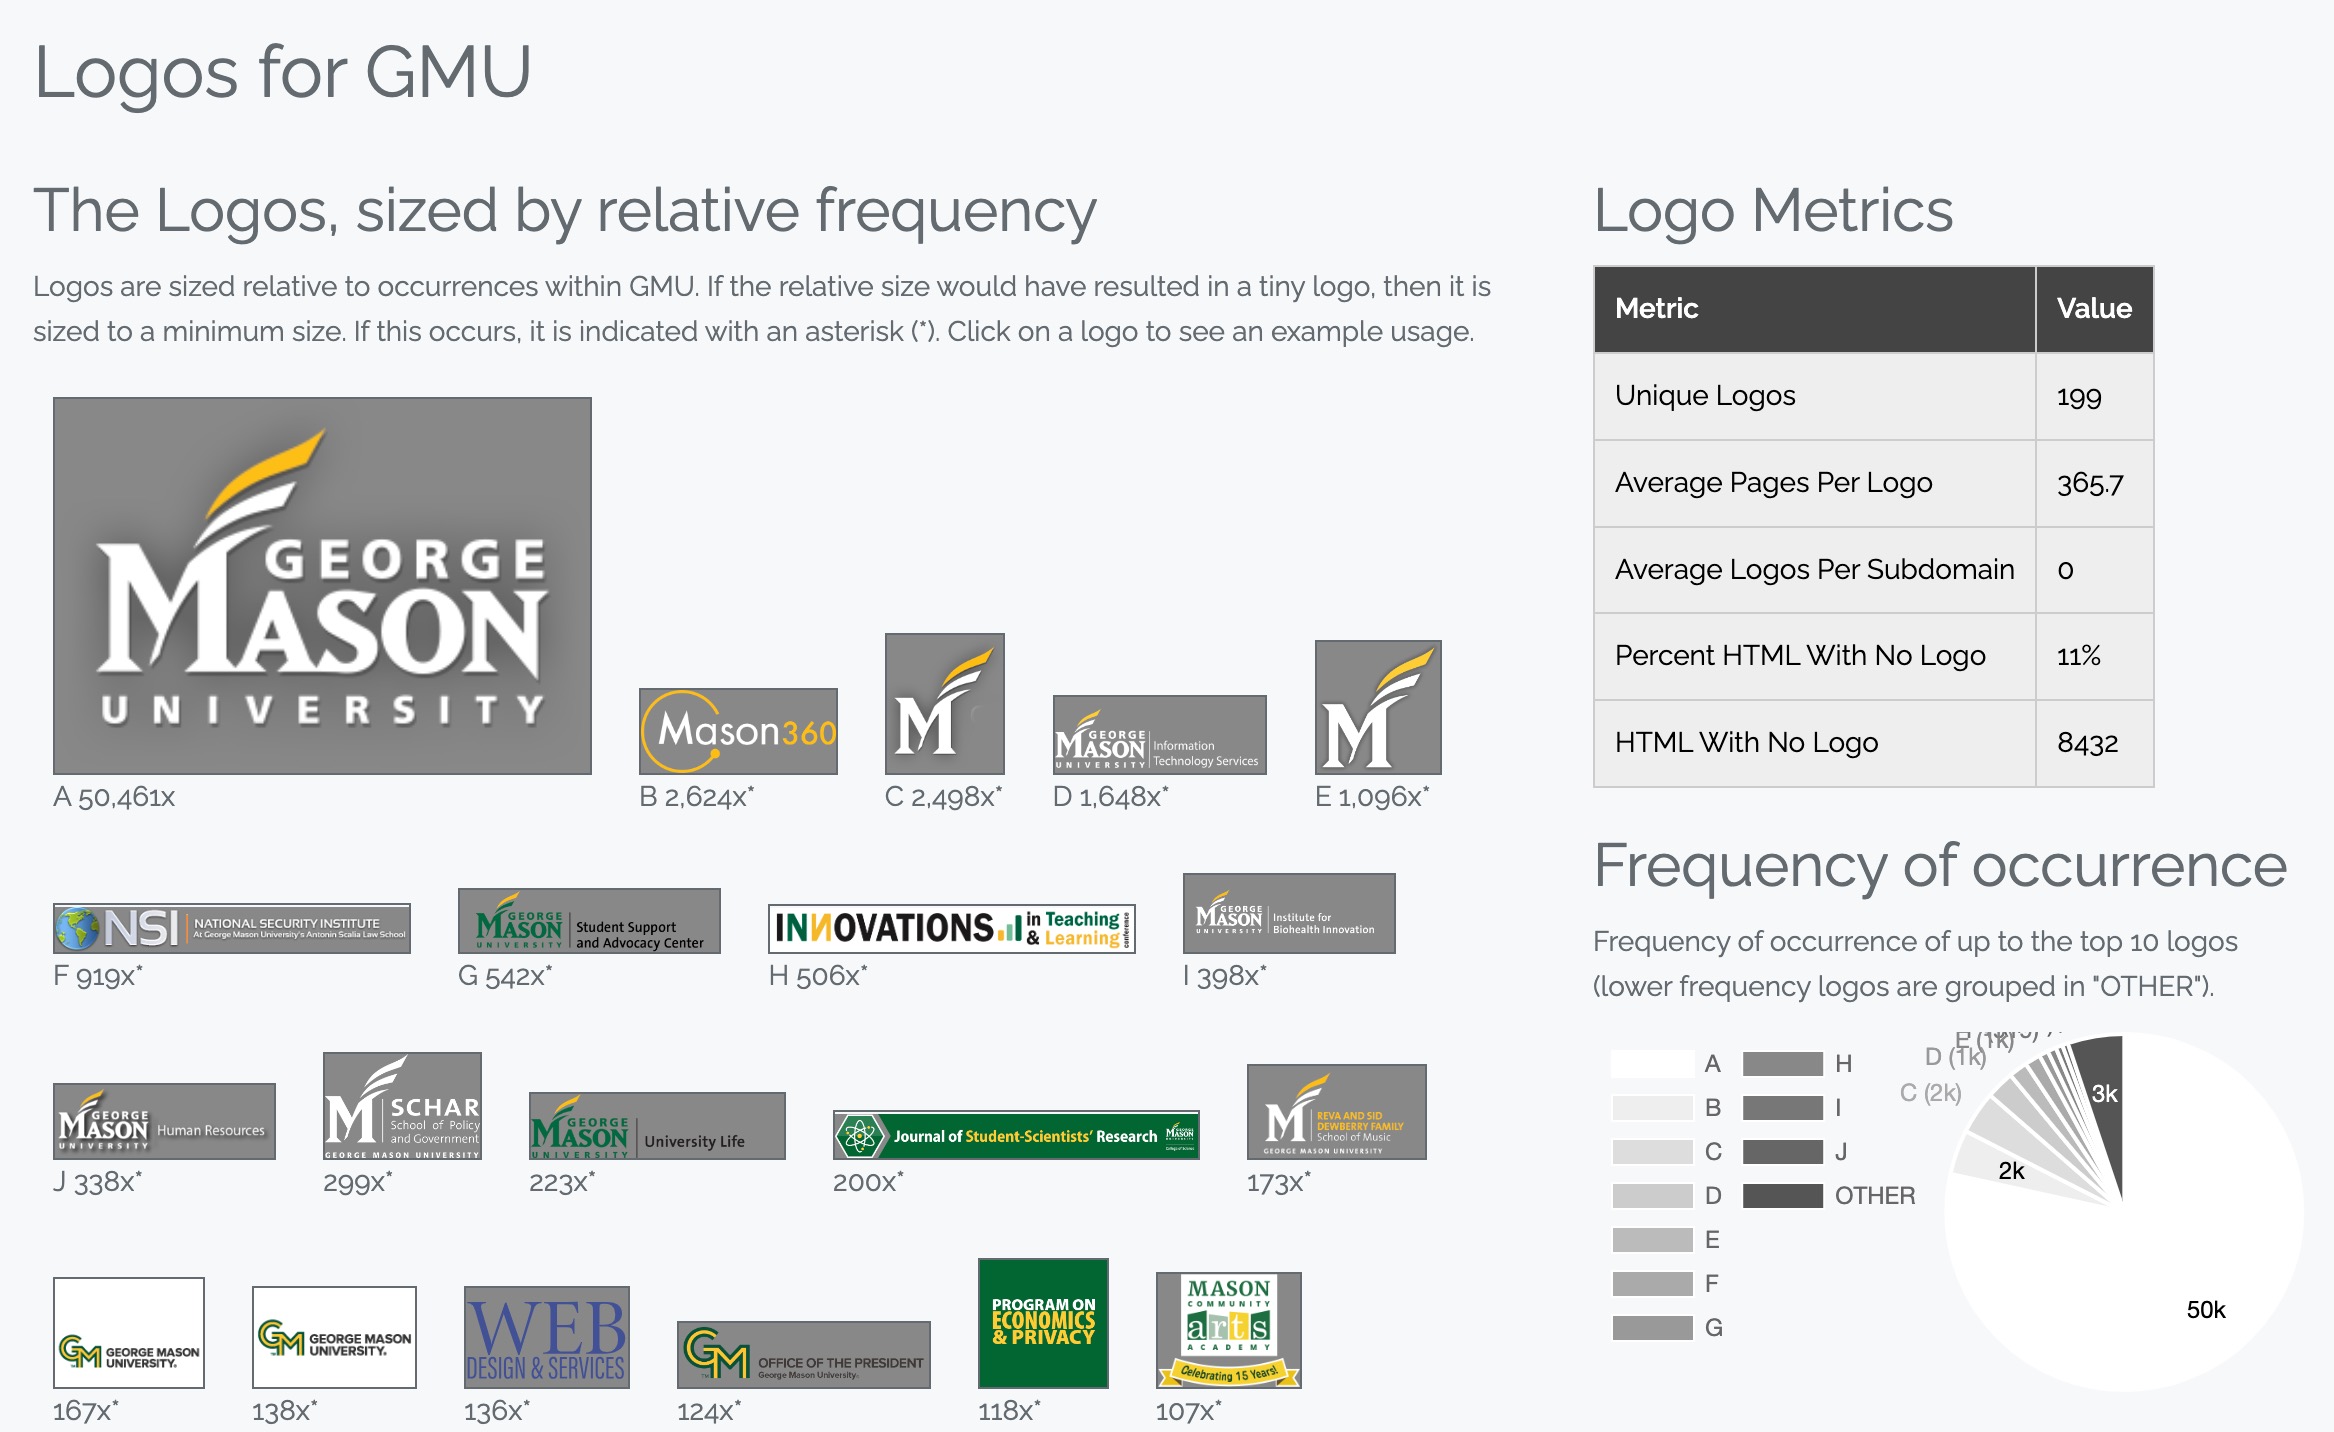
- An attempt at pulling out the primary logo per page, so you can then determine the consistency of logo use across a digital presence. Readiness: not sure, since we need more investigation to determine if the results are useful.
- Ability to create and use a hierarchical drilldown in charting. Chimera already has a lot of hierarchical charting, but this allows the user to create a pre-defined hierarchy that can be attached to a specific chart for the user to drill down through a hierarchy (rather than currently only being able to drill down the folder hierarchy or manually indicating the next level down at the time of drilldown). Readiness: not sure, mostly because we are still evaluating how useful this feature would be before polishing the UI.
- "Sitemap" visualization. Visualization of a hierarchy in "sitemap" style. Readiness: this is largely good to go, but we need to clean up some of the sizing and spacing in the visualization.
- Stellar Charts, which is a better way of comparing categorical information than a Radar Chart. Readiness: Very ready, aside from some UI tweaks.


Also, various fixes and tweaks:
- Hyphens can be in column names of custom display tables.
- Reduce cases wherethe crawler waits unnecessarily.
- Properly handle Australian domains (especially relevant in Encounter Domain Analysis grouping of subdomains).
- For calculated fields, can now have parent extents (like groups of sites) use the children extents (like individual sites) use the child's calculations (rather than creating a new calculation at the parent).
- When switching from another visualization to a custom table, the table now shows something useful immediately rather than requiring immedicate configuration.
- When scraping from meta tags, also try the "content" attribute (after trying "name" and "property").
- Default to normalize whitespace on scrape.
- A new ordered mapping type (to support the possibility of hierarchical drilldown).
- Can do text analysis (such as near text duplicate analysis) at aggregate levels (for instance, across a group of sites).
- Some added functions for calculated expressions: not, avg_zn (average, considering nulls as zeros, as opposed to the normal avg function which completely ignores nulls), and round.
- In detailed field information view, show the color (or colors in the case of multiple color schemes) of the most common values.
September 23, 2023 — Scaling Improvements
Chimera can now more effectively crawl larger sites (hundreds of thousands of URLs or more). In the backend, this means more parallel processing, more batch activities, and many other improvements to handle a variety of conditions that arise in large crawls. In the UI, this means you'll see more steady progress and fewer slowdowns on large crawls (although crawl speed naturally can change for example when the crawler hits a pocket of very large pages).
July 5, 2023 — Usability Improvements
Content Chimera development always faces the tension of 1) adding bleeding edge features for the complex digital presences that David Hobbs Consulting analyzes and 2) making Chimera easier to use for new subscribers.
We've gotten a bunch of great feedback on the onboarding experience. We've made a a variety of UI changes:
- When launching a major process (like importing, crawling, merging, and running rules), now Chimera does "preflight" checks. So now instead of a job failing after starting, Chimera will first warn you (or stop if it's impossible without adding information) to give you a chance to course correct before actually launching. We'll be adding more intelligence to the checks, but for now some of the basics are covered.
- When modifying charts, there's now a new Simplified mode (which is also the default), which only includes the main configuration buttons and also highlights those that are required.
- Better feedback when trying new patterns.
- New users were confused about where they were in the navigation, so now where you are is highlighted in the global navigation bar.
March 17, 2023 — Content Transformation Effort Estimates
Content Chimera now allows estimating per-content-item content transformation effort, with the assignments page now showing the aggregate effort per disposition:
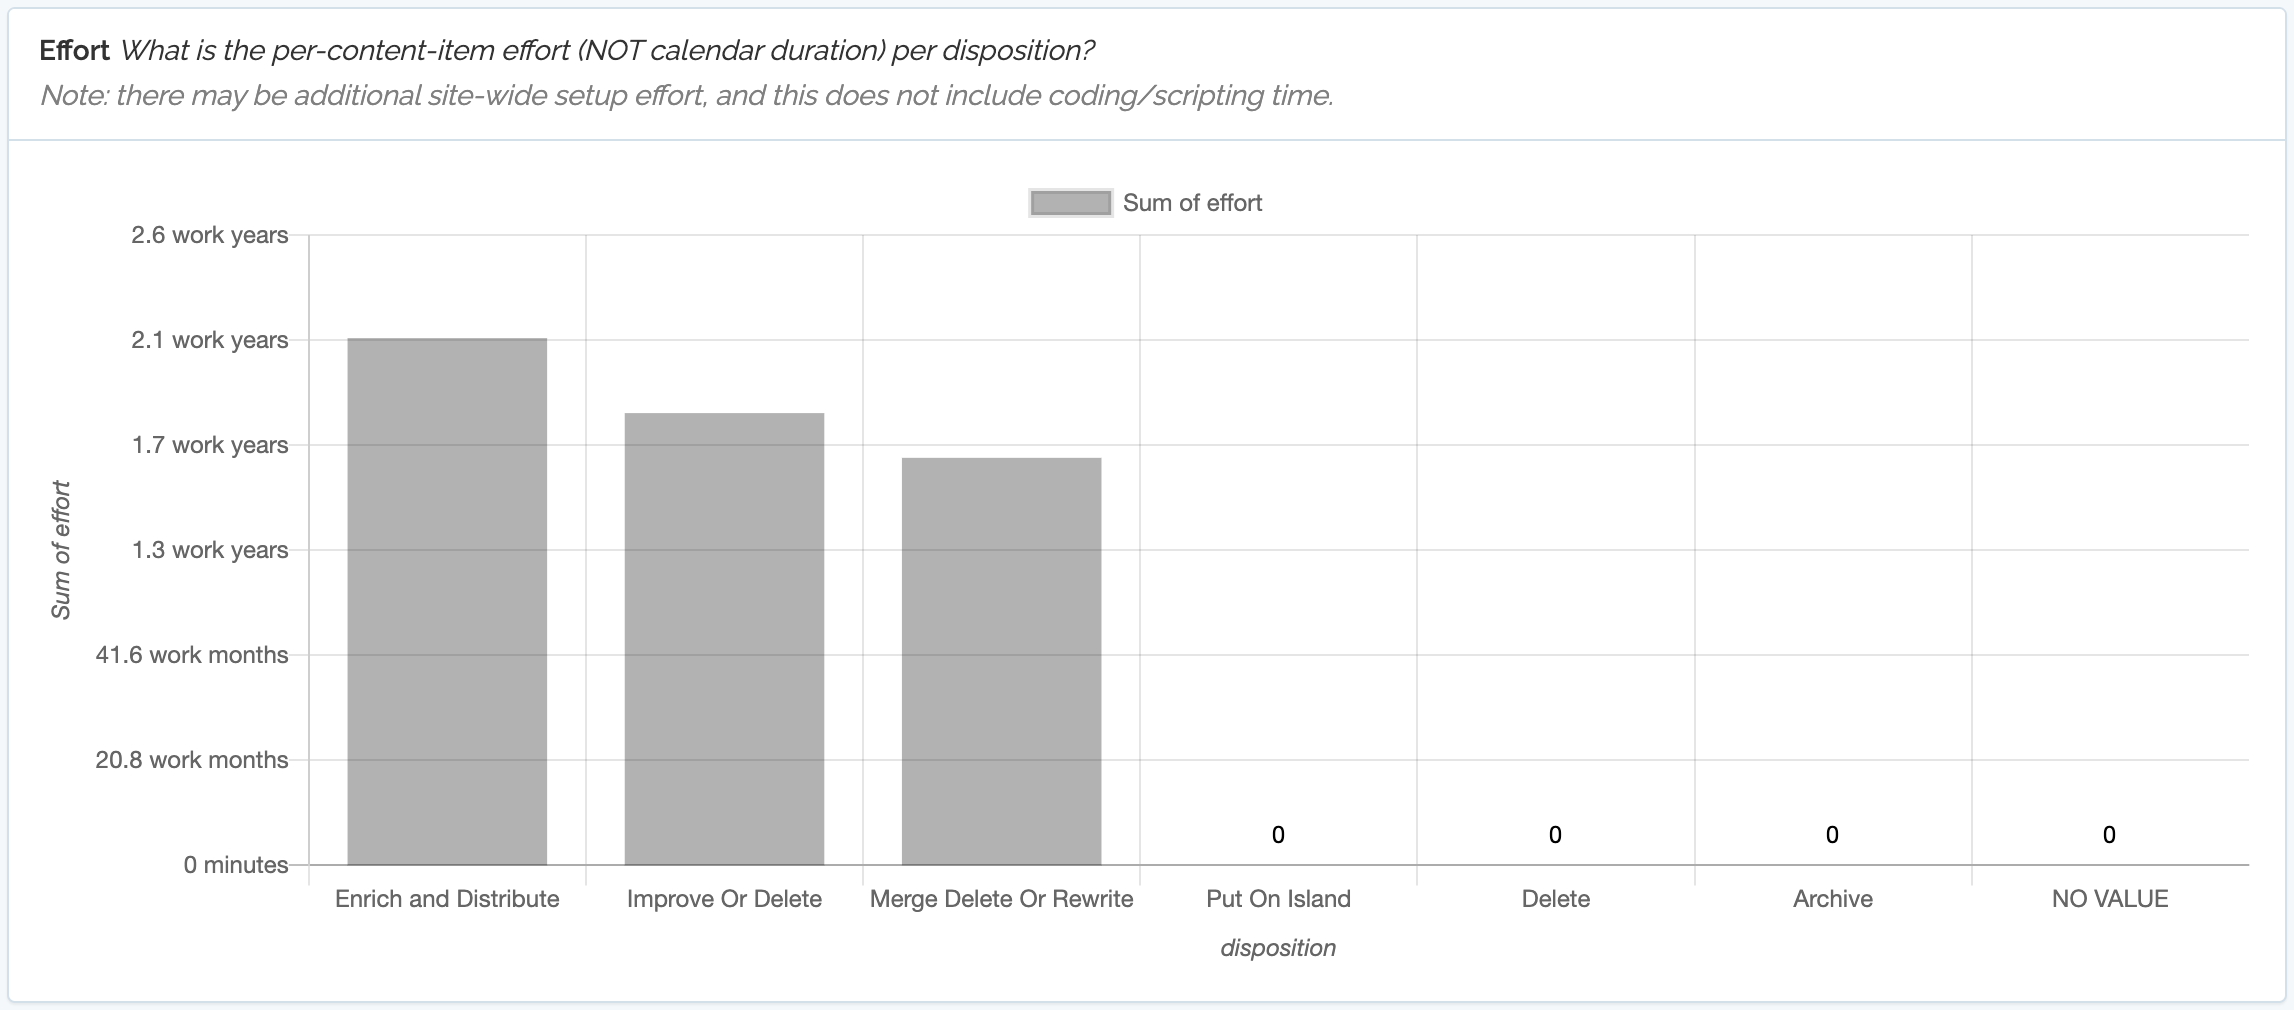
This is based on rules (long-time functionality) and dispositions (new functionality).
The end result is that there is now an estimate, per content item, of effort to transform that piece of content. This is stored in the "effort" field, where number is the estimated number of manual minutes to transform that content.
January 11, 2023 — User-Created Reports
You can now create your own reports in Content Chimera. Reports help you either build a story around a website toward driving change, simply pull together information to illustrate current state, or an ongoing dashboard that updates as the underlying data changes. Content Chimera reports:
- Automatically update when the underlying data changes (for instance, if you import new data, update the rules you define about content, or scrape new or updated information.
- Are still interactive (you can click to sample underlying data).
- Leverage all of Content Chimera's visualizations.
- Can be managed by any full user (Team level subscriptions and higher now also have a read-only user type as well).
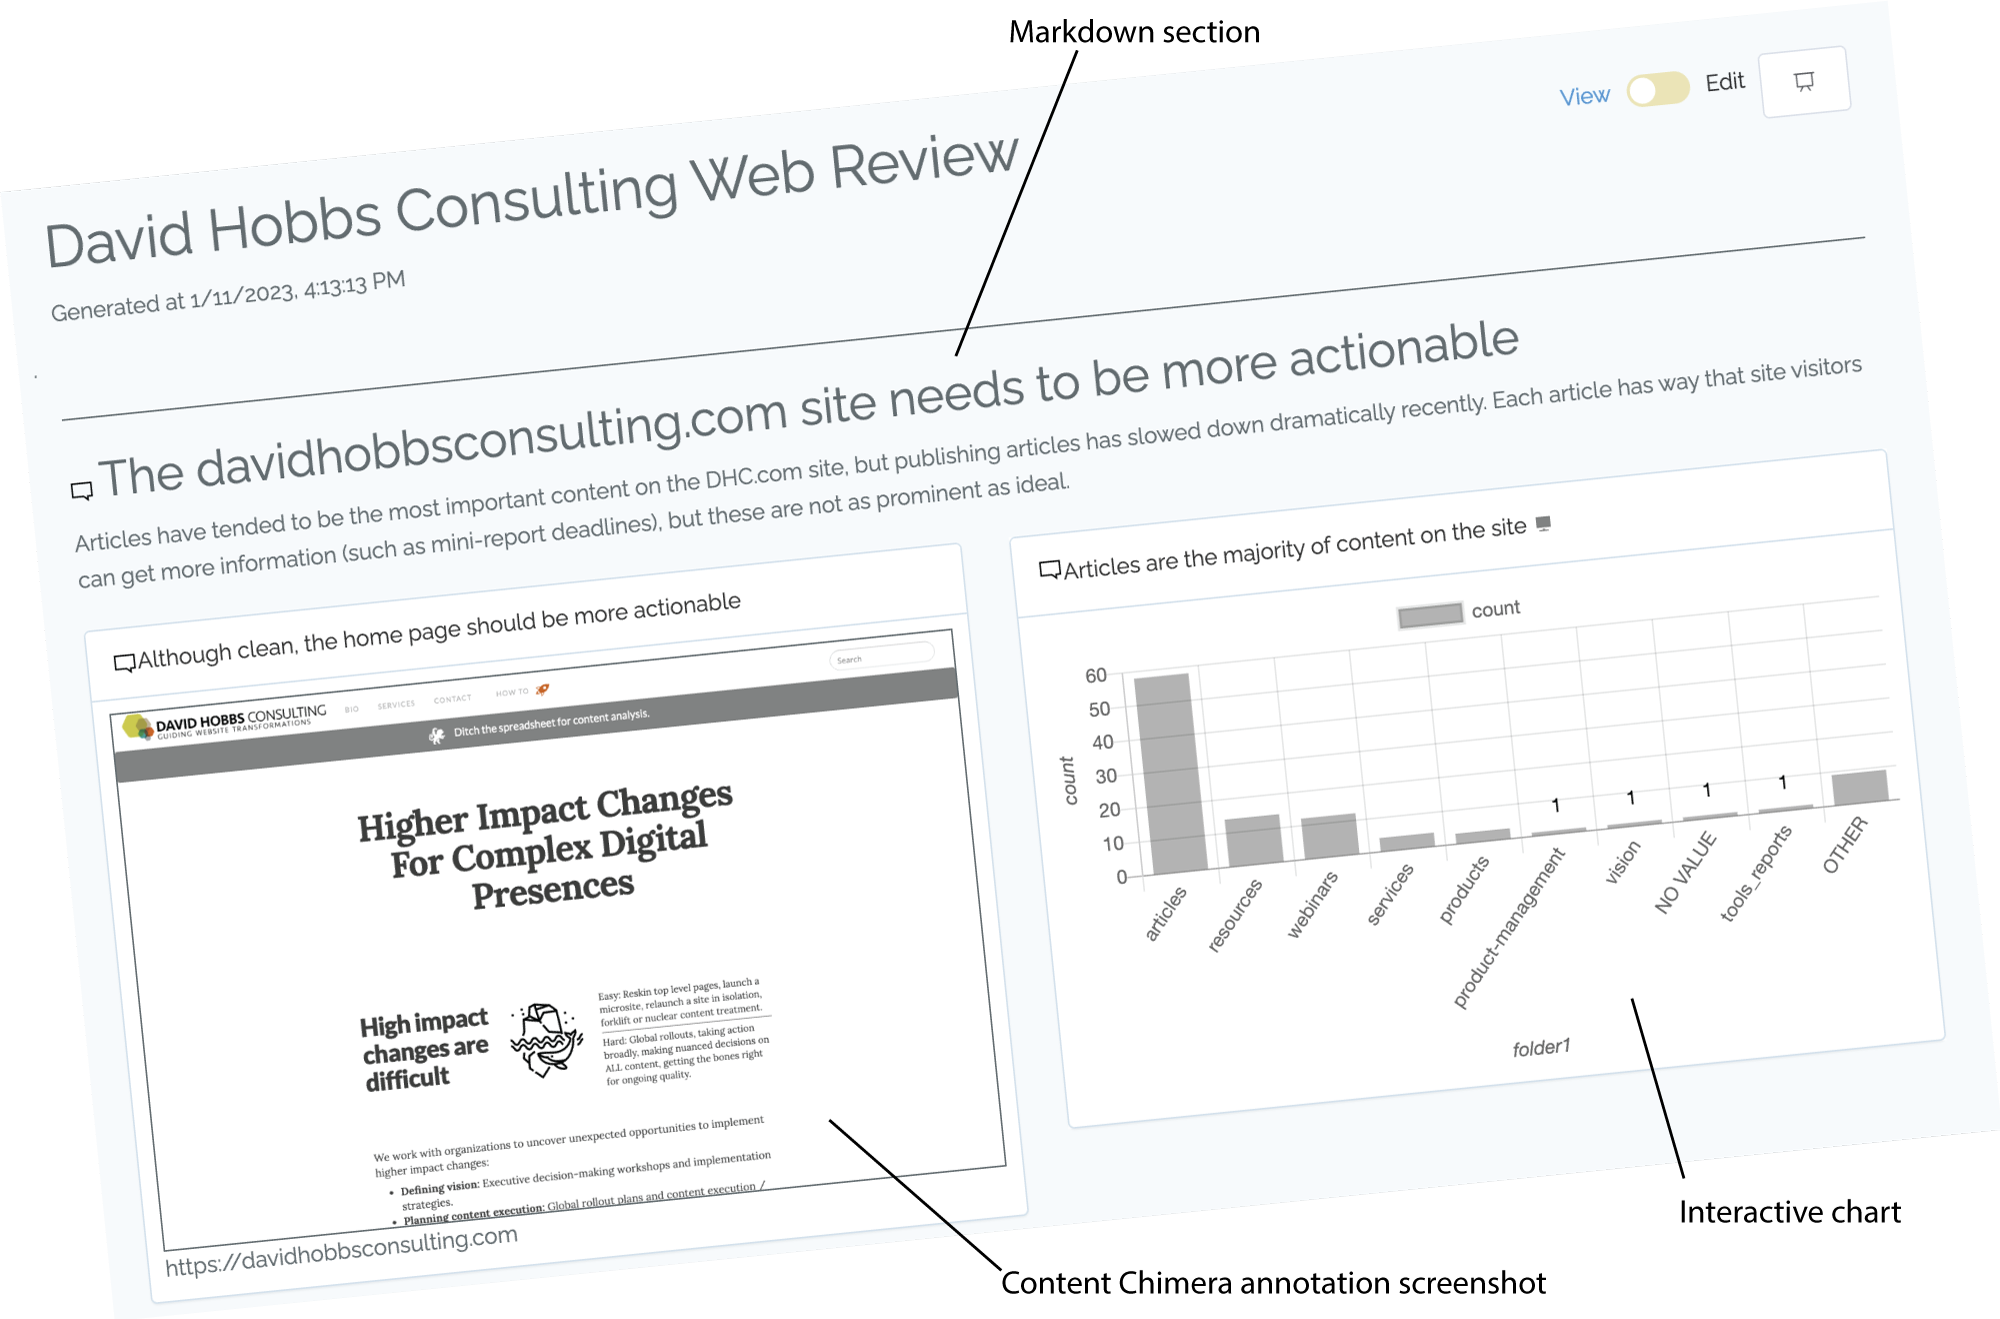
Chimera reports are a blend of:
- Sections, which are headings with Markdown blocks (where you can add tables, lists, and checklists)
- Charts, where any chart can be embedded
- Annotations, which are screenshots that have been saved with notes.
- Images, which can be diagrams, flowcharts, or whatever you need to illustrate your data story.
Read more in the documentation.
November 7, 2022 — Encountered Domains
Content Chimera can import data from many data sources, including dedicated crawlers. Now one advantage of crawling with Content Chimera is that it will automatically do an analysis on encountered domains. Note that this happens automatically, and it considers links from all pages in the crawl. Read more in the documentation.
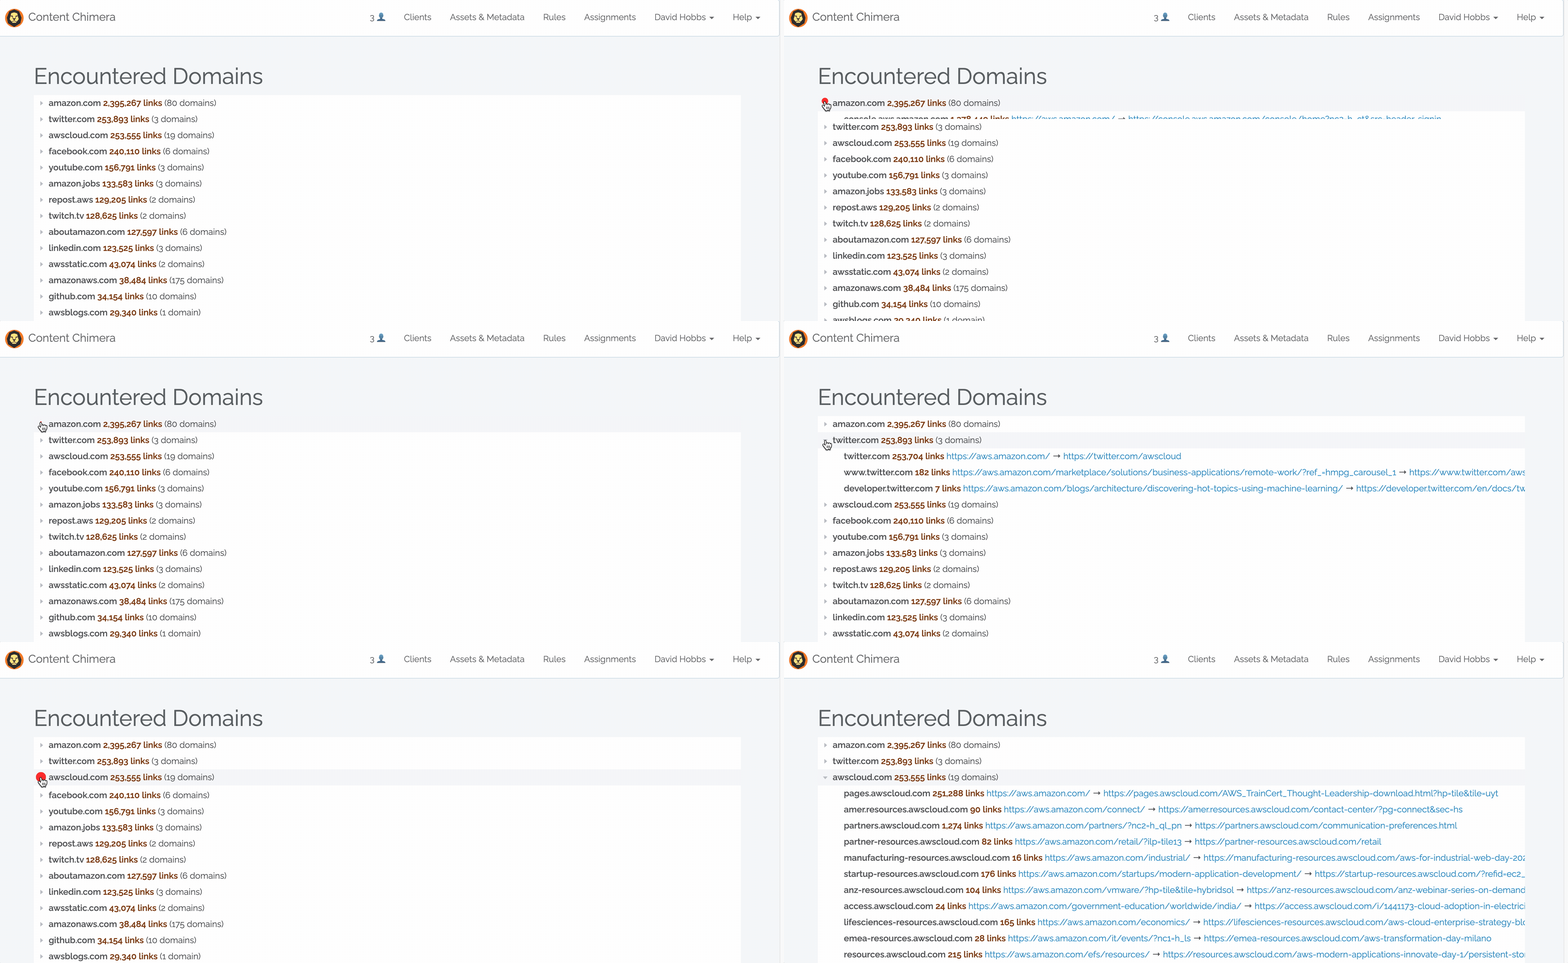
October 21, 2022 — Improved filters
Although powerful, the shared filters to date have been a bit confusing. There's now a new way to define filters that's faster and easier:
- No need to go into advanced chart settings: just click the plus button at the top of the chart.
- In most cases, you just want to filter on whether a field is equal to a certain value. So by default the equals operator is set.
- Instead of having to remember the possible values, once you select a field the values pulldown shows the top values with their counts (note: this may be a feature only available to higher subscription tiers in the future).

Read the documentation on filters.
October 19, 2022 — Backend Improvements
We at David Hobbs Consulting have been making a lot of experimental improvements in our clients-only environment but haven't yet pushed them to the production environment. Today we made a variety of boring under-the-hood changes (version upgrades, etc) that will allow us to roll out a variety of improvements in the coming weeks and months.
August 18, 2021
We just deployed a bunch of improvements to Content Chimera. Most of them are small changes, such as: better optimizing for charting with a large number of columns, more backend logging in general for better debugging and monitoring, in calculated fields you can now use non-boolean functions to evaluate as booleans, scatter charts are now available (this will be more fully launched when included in the help documentation), in heatmap tables zero values are now in a very very light pink (so visually you can more quickly see cells that have values at all vs. those that do not), better handle CSVs where a column or multiple columns have one or more newlines within them, and for multi-value analysis deal with field names that have blanks in them.
The bulk of our recent work on Content Chimera has been toward new capabilities for ongoing inventories (the changes so far are backend and are not yet available). This is a significant new set of functionality so will take some time to implement. Some of the specific features are: time series charts, custom data pipelines (a sequence of steps in acquiring and massaging data, such as crawling the site then pulling in the latest analytics data), programmatically connext with analytics APIs, saved job parameters so they can be better run in the background without user intervention, feature to step back through time in charts, and scheduling the pipelines. This functionality may only be available for the top tier subscription level, and targets enterprises.
June 1, 2021
Annotations
You can now take notes on pages, even on other sites (for instance, competitor site pages that will never be in your primary content analysis) or during a crawl (before the page has been fully processed by Content Chimera).
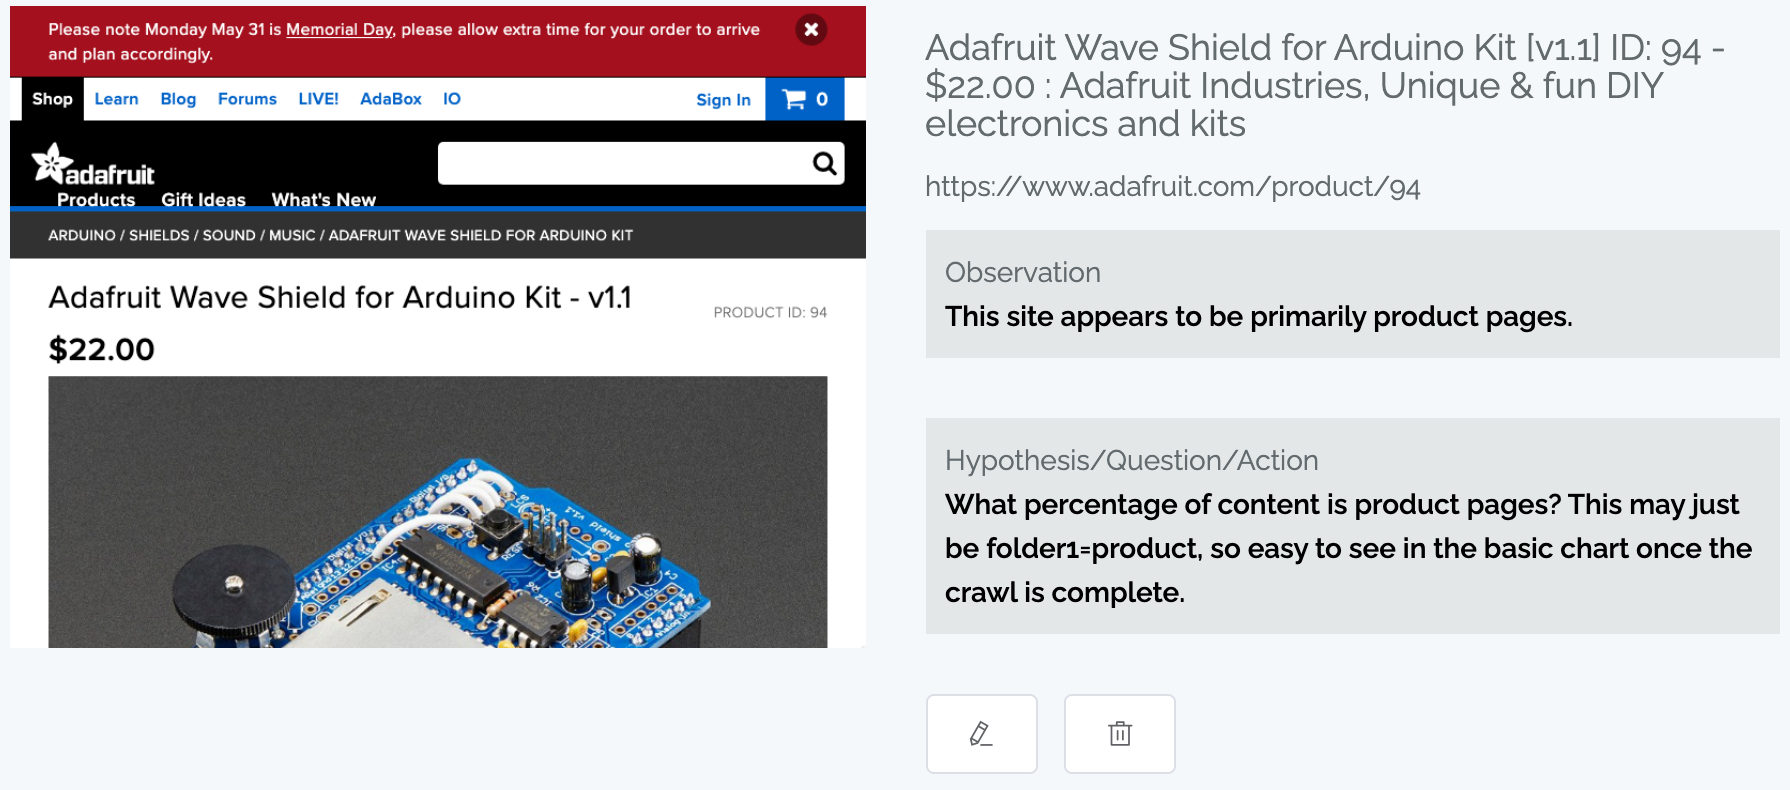
The intention is to capture your thoughts when looking at examples in order to better inform further analysis using Content Chimera. For instance, you may find an example of an issue but you aren't sure if it is pervasive or not. You can note this observation at a time when you can't dive into that analysis (when meeting with a client, during a crawl, etc), and then when you are ready for deeper analysis you can look through your annotations to do the subsequent graphing or adding data to answer your questions.
Major performance improvements, especially for large sites
Very large sites expose a variety of problems that just do not occur for smaller sites. For instance, we recently resolved an issue that arose when some servers are extremely fast at serving very large files. Also, Content Chimera can now better handle multiple very large processing jobs at the same time.
There have also been some large performance improvements that are especially useful for large sites but even smaller sites will benefit. For instance, Content Chimera now processes URLs after a crawl ten times faster. In addition, scraping content off pages is two times faster.
Tours
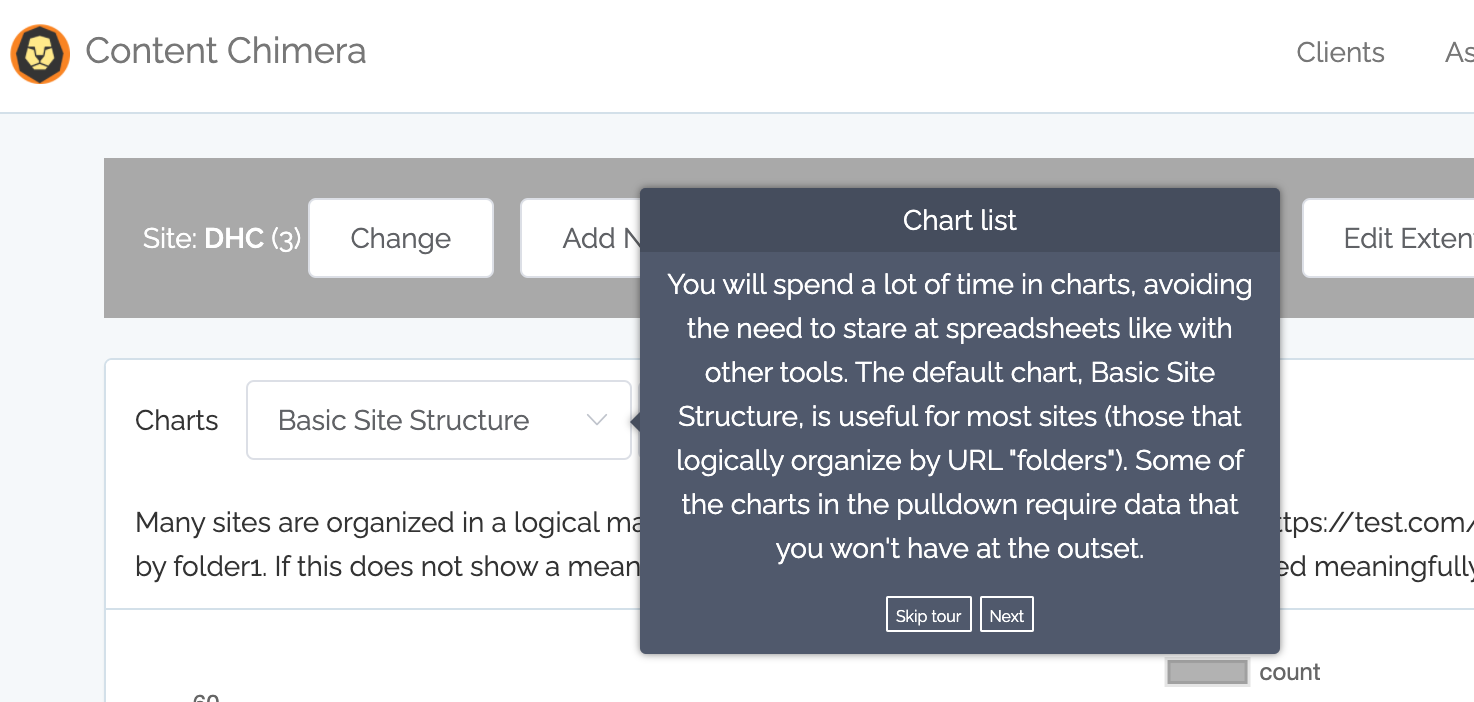
By default key pages will now show a tour.
Various other improvements
- Updated quiz for selecting a content analysis tool, which will give answers from a free tool up through Content Chimera, depending on what you are trying to accomplish.
- You can now see the crawl configuration from the crawl progress page by clicking the "i" icon.
- Better new user onboarding
- Improvements to how filters work
February 22nd, 2021
Screenshots
Content Chimera now captures screenshots. Whenever you go to the detailed view for a particular page, you will see a screenshot if it already exists. If the screenshot does not already exist, it will attempt to get one then. Content Chimera also collects approximately the first thousand screenshots during a crawl (this is a crawl configuration option, so screenshots can be turned off).
Higher-priority processing
Users on Pro or Enterprise Subscriptions now get higher-priority processing for long-running processes like crawling. Starter plans get normal priority processing.
Various other improvements
As usual, development was far more active than may be obvious in these updates. Monitoring and scaling is always being worker on. In addition, here are some other changes:
- Better archiving. Archiving a site can take some time, but this was not obvious on the clients page. Now there is an Archiving state that appears until a site is actually archived. There's also a new documentation page on archiving.
- Better crawl default configuration. Content Chimera now has more lenient configuration options by default. This should result in better results in most cases. Also, crawl circuit breakers (which help to avoid many unproductive crawl paths) are enabled by default. Content Chimera has had circuit breakers for a while but it was not on by default.
- Even more complex CSV parsing. Yes, CSVs are a relatively easy format. But there are tricks about how double quotes and newlines are handled. Content Chimera now handles more cases.
- Removed random Greek names. The trial used to allow you to not give your name, and a Greek name was created instead. The attempt was to make onboarding in the free trial easier, but it actually just confused things. Now you must give your name in the free trial.
- Lower-priced subscription tier. We are now offering a Starter plan, with up to a 10,000 URLs.
- New helpdesk approach. We are moving away from Slack support and are using a more normal ticketing system, available from within Content Chimera.
February 10th, 20201 — ContentWRX and Content Chimera partner for stronger content analysis
In this partnership, current ContentWRX Audit customers will move to Content Chimera. This will mean those customers will gain the more comprehensive content analysis features of Content Chimera from visualizations to making decisions based on rules. In addition, Content Science will provide support for Content Chimera.
January 25th, 2021 — Table View!
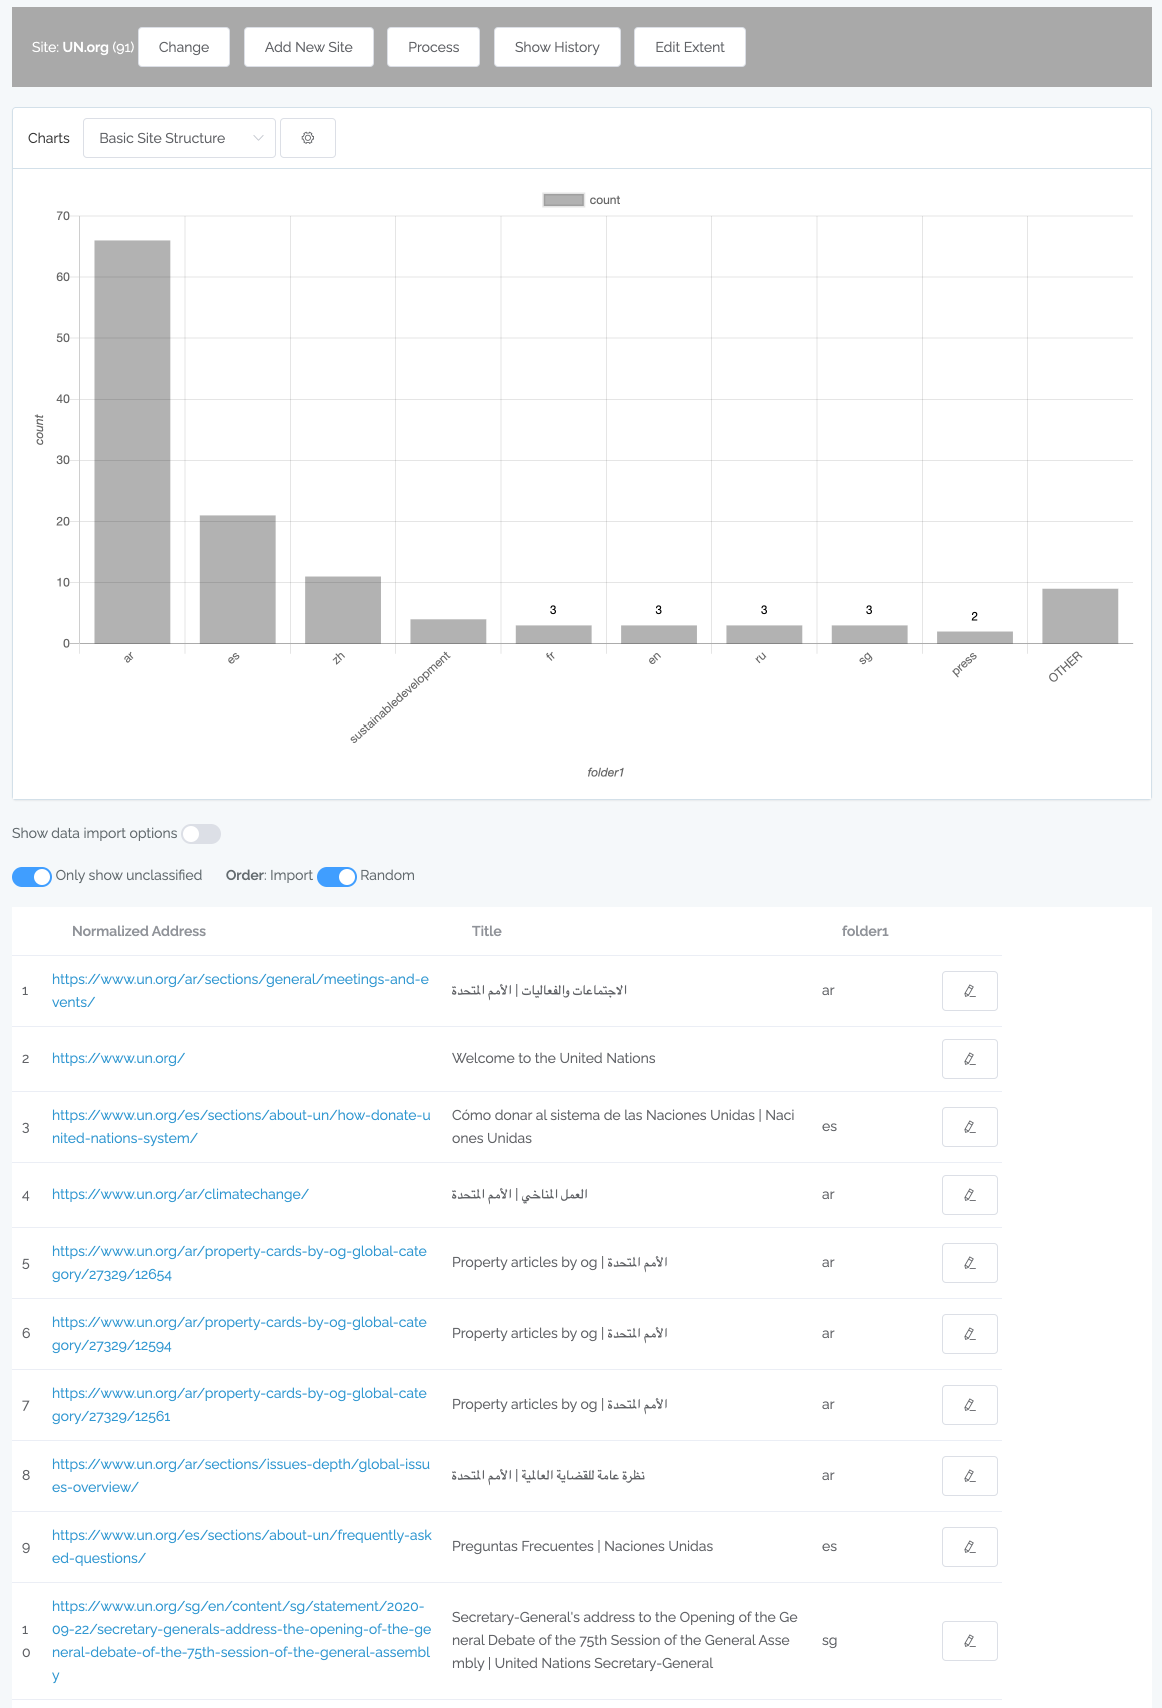 Read more.
December 17th — Drill Down!
Drill-down and rules directly from the chart
If you are charting site sections, you can now drill down into sections directly without manually creating filters or changing the chart config. You simply click on a chart bar, then click to Drill down, and accept the defaults: then you see a chart with the subsections under that initial section.
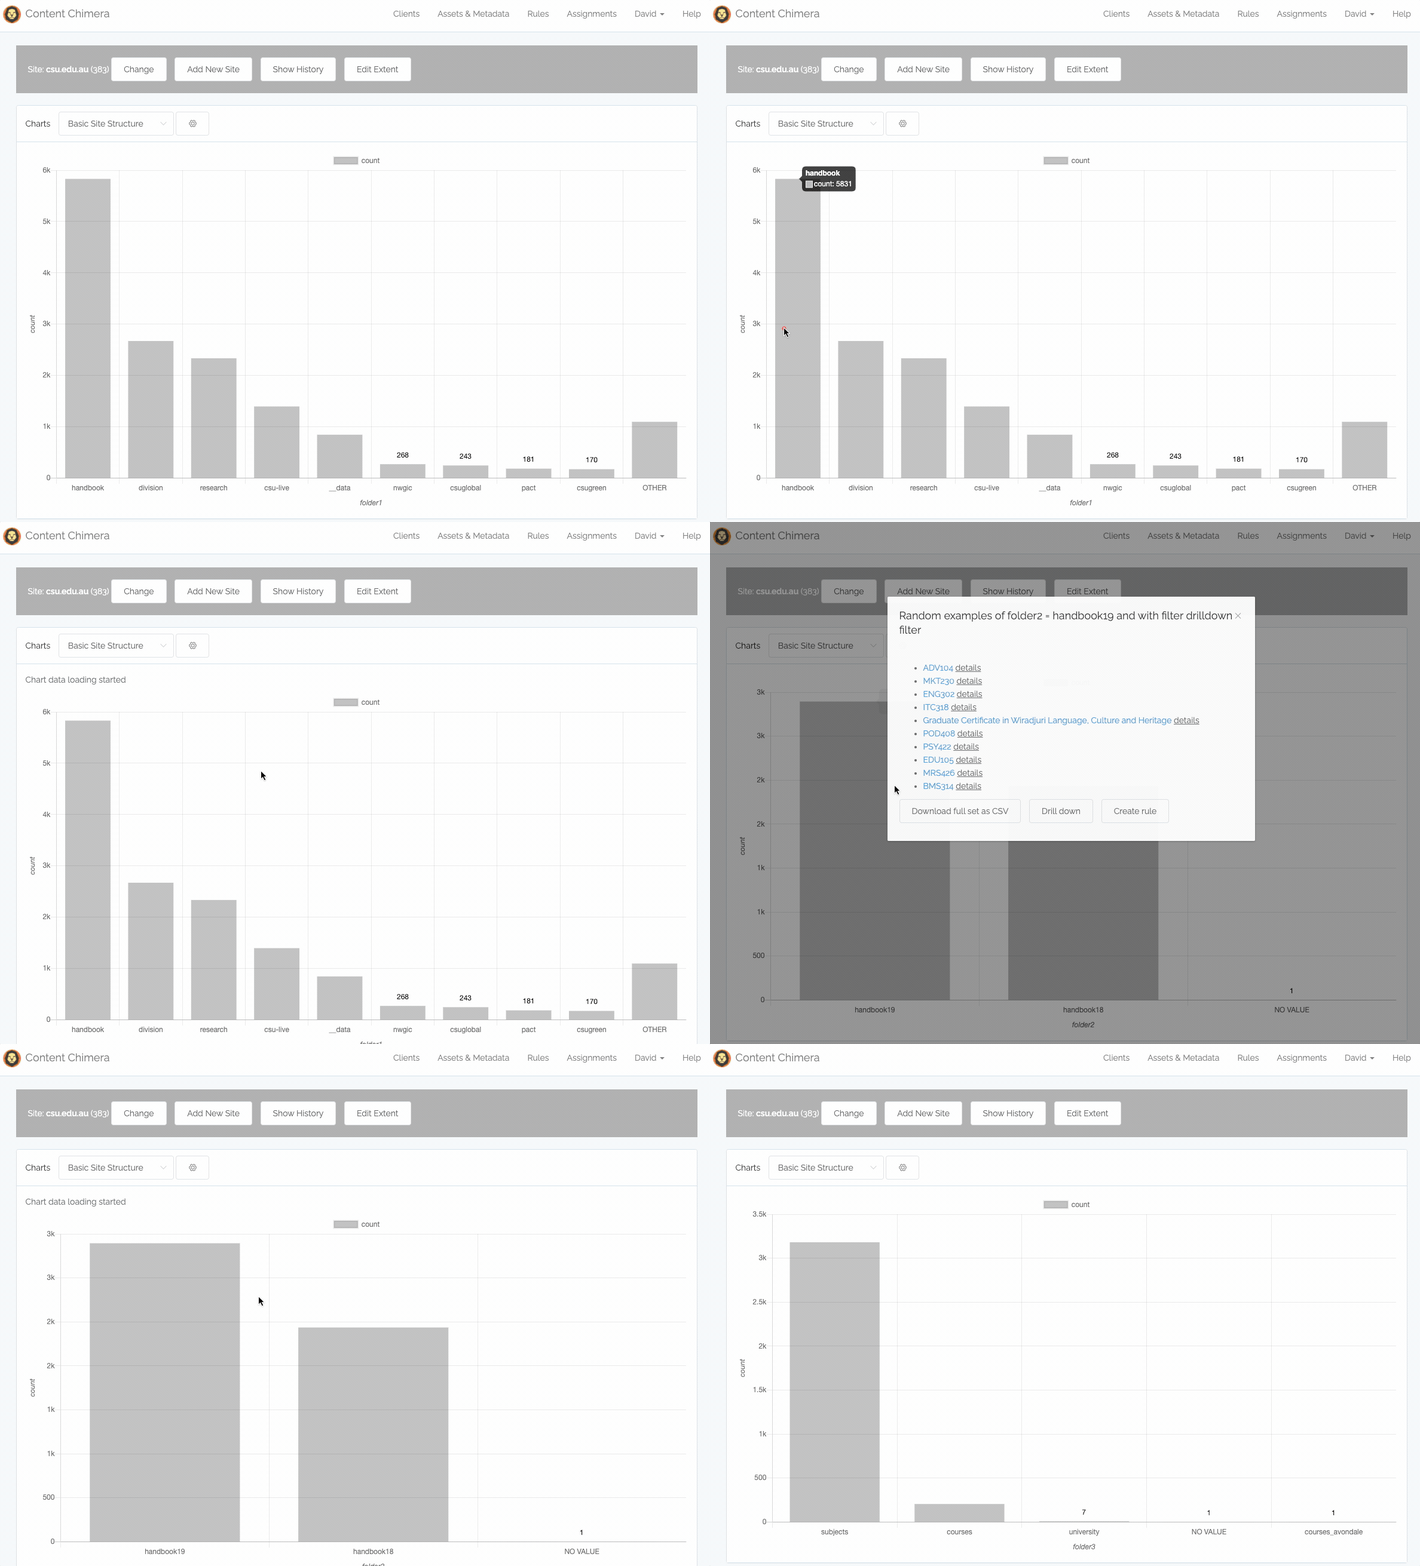
In addition, you can now directly create a rule from the chart. You simply click on a chart bar and can then create a rule for that bar (or of course you can still create more sophisticated rules on the rules page.
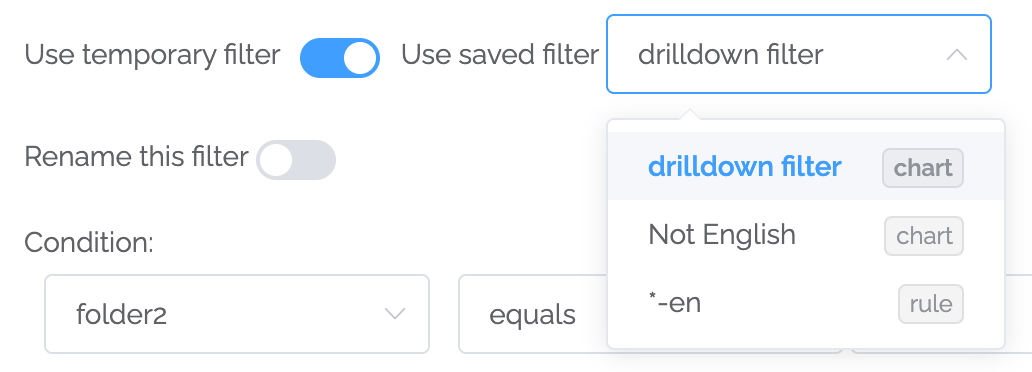
One side-benefit of drill-downs is we had to make improvements to filtering in general. For example, in the list of existing filters, you can see whether the filter is already being used in a chart or a rule.
Static IPs
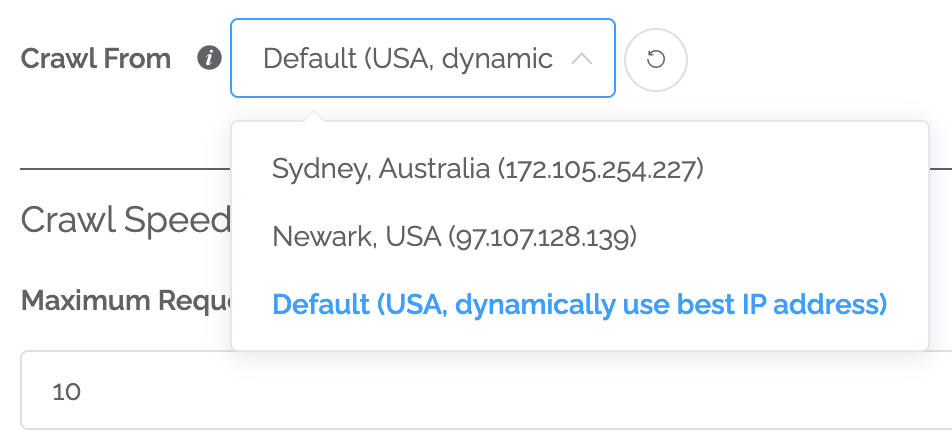
By default, Content Chimera dynamically selects a server (in Northern Virginia, USA) for crawls. This will generally lead to the best performance. But there are a couple reasons you may want to crawl from a specific server: 1) if you need to be crawling from a specific location (like a site that will not serve pages to another region) or 2) if you need to change firewall rules or robots directives to allow only certain IP addresses in. Now you can select to use a specific server for a crawl (and set it as the default for a particular site so crawls always use that server). Currently the servers you can select are in Sydney, Astralia and Newark, USA, but we can add other locations if necessary. Note that crawling from one of these servers will mean at least a slightly slower crawl, but this option is available if you need it.
Scaling and monitoring
We are always making scaling and monitoring improvements. Most are pretty technical and toward things "just working" for our customers. That said, two things stand out as improvements you may notice:
- Radically faster random sampling of large (clicking on a bar that represents hundreds of thousands of pieces of content) datasets when clicking in charts.
- Faster processing of multi-value data (like taxonomy values) when refreshing summary tables.
International improvements
Content Chimera is optimized for large, international digital presences. That said, our work remains interesting since there are always new challenges encountered in complex crawls. Here are some of the things we've recently improved:
- First non-USA server (see static IPs above)
- Better handle Russian URLs
- Better handle Hong Kong domains when following all subdomains during a crawl
- Generally safer handling of any unknown or problem encodings
Bug fixes and improvements
As always, we are working on a variety of small changes and bug fixes, including:
- Filters now correctly pull assets with null values in "not equals to" conditions.
- Exporting a CSV after clicking on a bar in a chart will correctly show a header row when only one field is being charted.
- Get notified by email before recurring subscription charge.
- Better handle when the very first URL in a crawl is blocked by robots directives.
October 27th — Content Chimera launch!
Launch day improvements! Although we made a ton of improvements behind the scenes getting ready for lauch, below are the most noticable ones.
Quizzes (no need to log in)
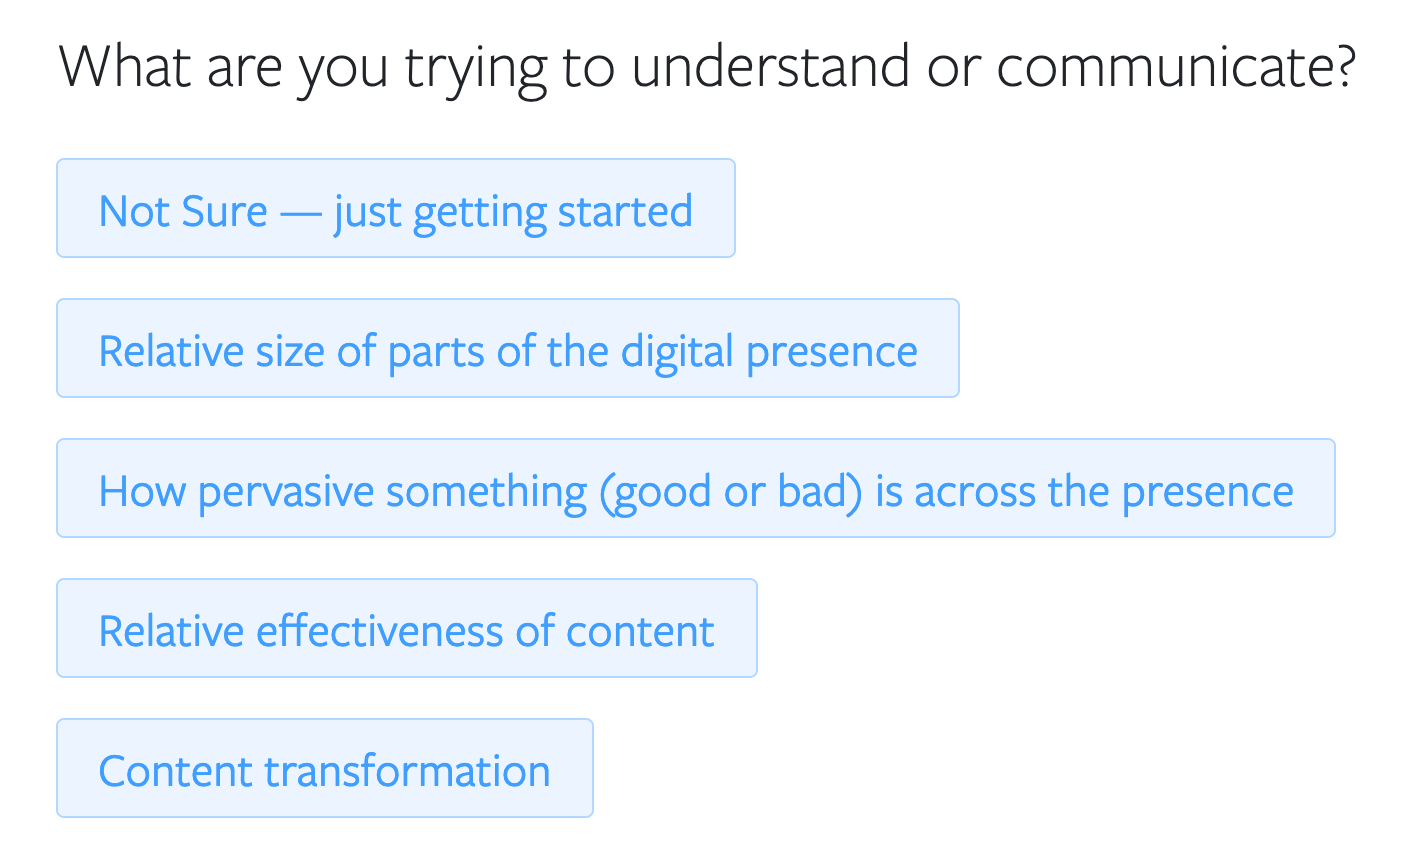
We have added the ability to take quizzes in Content Chimera. The first thing we implemented was a wizard to select the right chart for content visualizations:
Sounds and email notifications
One of the core aspects of Content Chimera is that you can start long running processes and return to them later, even across devices (no need to be tied down to the device you happen to start a crawl on for example). Now, Content Chimera will also alert you when a process is done. When a long process completes normally you will both receive an email and a sound will ring (if you keep the browser tab open in the background). If a process completes in error, you will hear an error ring (so you can respond to any issues quicker).
For more: Walking away from long processes.
Revamped help documentation
We completely changed our help system, including a new section on the principles of Content Chimera:
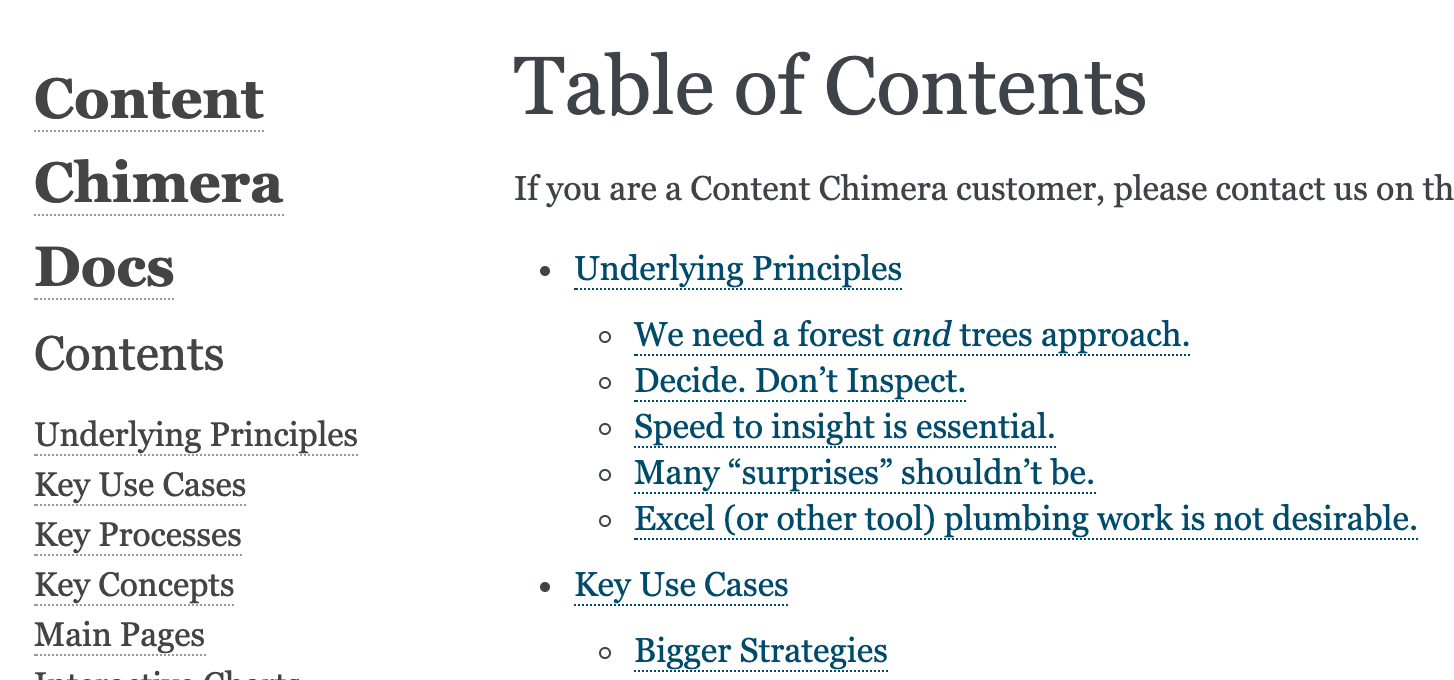
Quickstart paths (free trial)
Quickstart paths allow you to enter a URL and then automatically Content Chimera will do several steps of analysis (including starting by crawling) and generate a multi-chart report. Note that currently this is only available for new users as a trial (only for the first thousand URLs). Start a quickstart path for initial migration analysis or a brief content analysis.

Pervasiveness Tables
Pervasiveness tables compress a great deal of information into a small table. These show how pervasive different elements are across the site (in this case, the rows are content types and the columns are percentages of pages with at least one metadata value of that type):
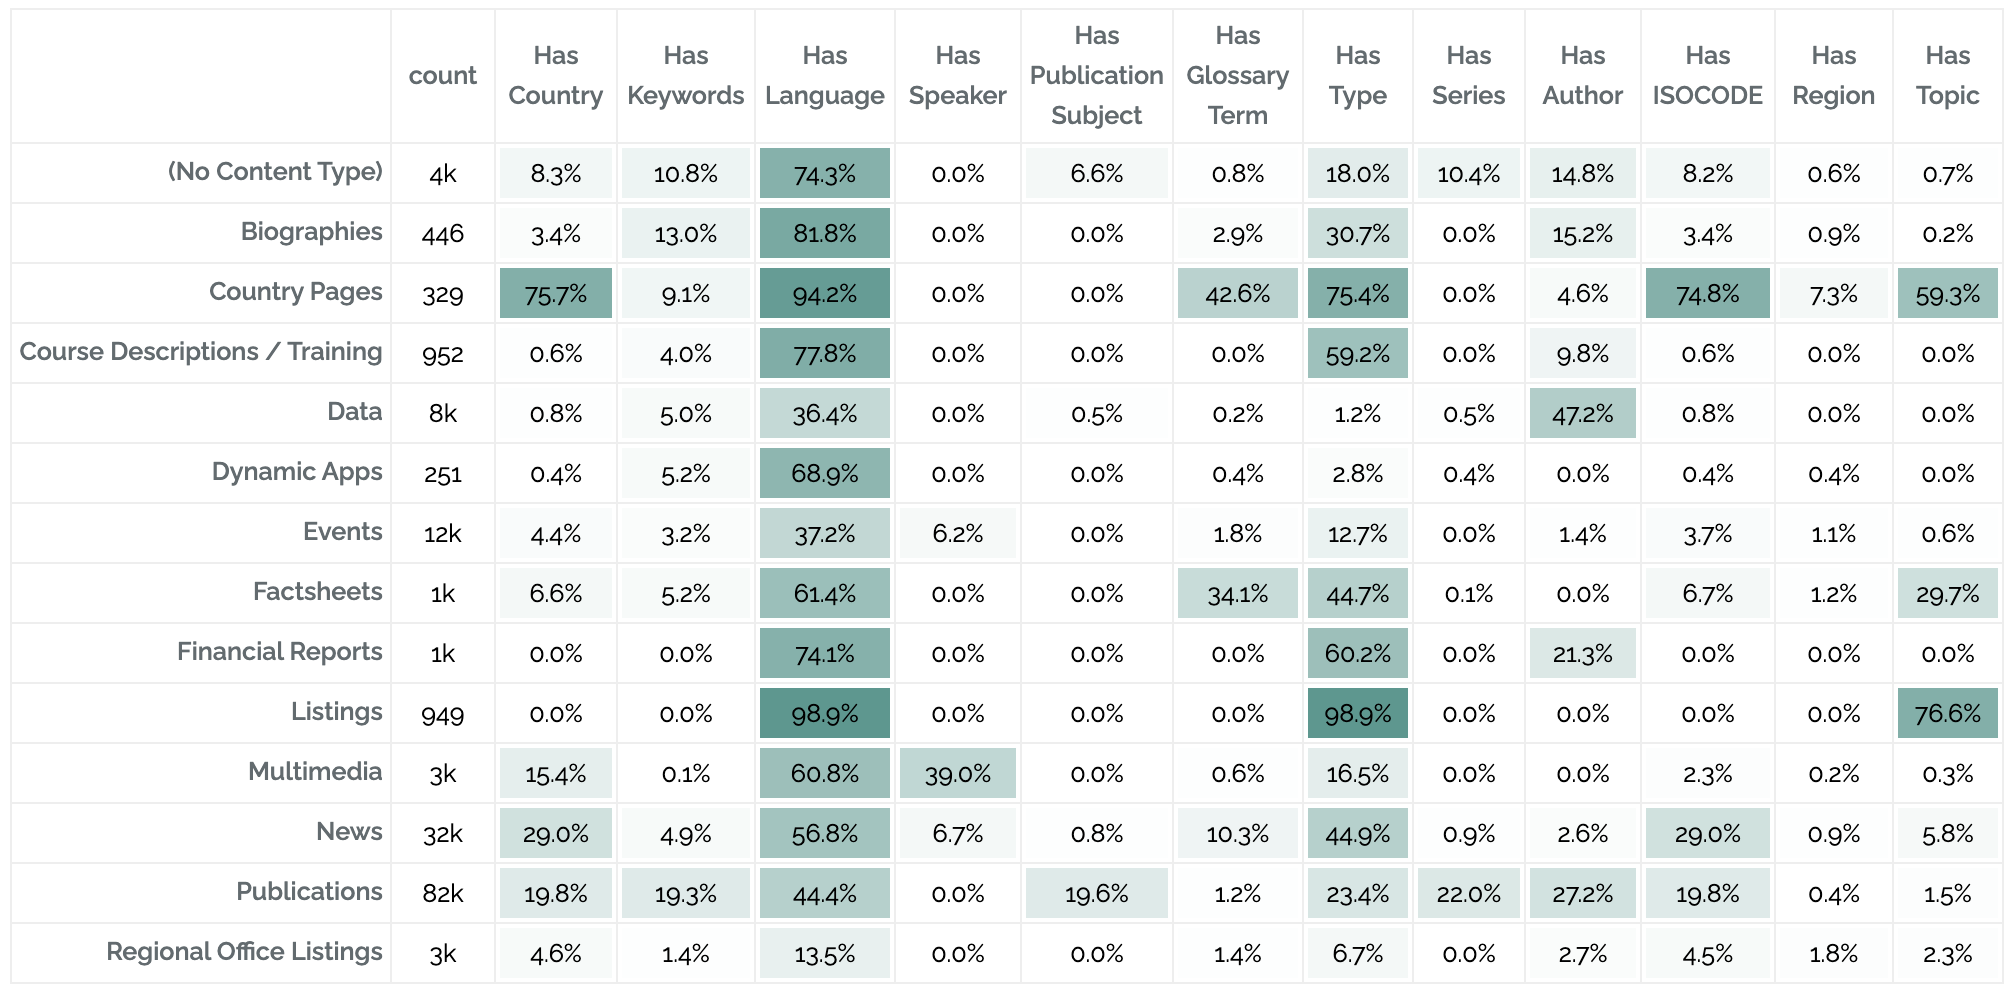
For more on pervasiveness tables: Pervasiveness and Heatmap Tables: Visualizing the Big Picture
Archiving digital presences (relevant for agencies and consultants)
If you reach a point of being "done" in an analysis for a client, you can archive the analysis of their digital presence in Content Chimera. You will no longer be able to add more information or use rules, but you can still use the charts. This is useful for you to manage your maximum URLs and digital presences in your Content Chimera license.
Lots of speedups and scaling improvements
- Charting speedups
- Upgrade to new versions of various backend frameworks and libraries
- Improvements allowing faster iteration on analysis when adding data
- Various improvements for crawls of sites over a million pages
Various other fixes
- Handle very long, multibyte link labels (we first encountered this on some Russian pages)
- Better navigation when on a mobile device
- On progress circles page, show extent name rather than id
- Improved user onboarding
2 September 2020
A ton of improvements, especially around charting, scraping and crawling. Also, the backend we have been working toward the capability for a report/dashboard that contains many dynamic charts.
Charting improvements
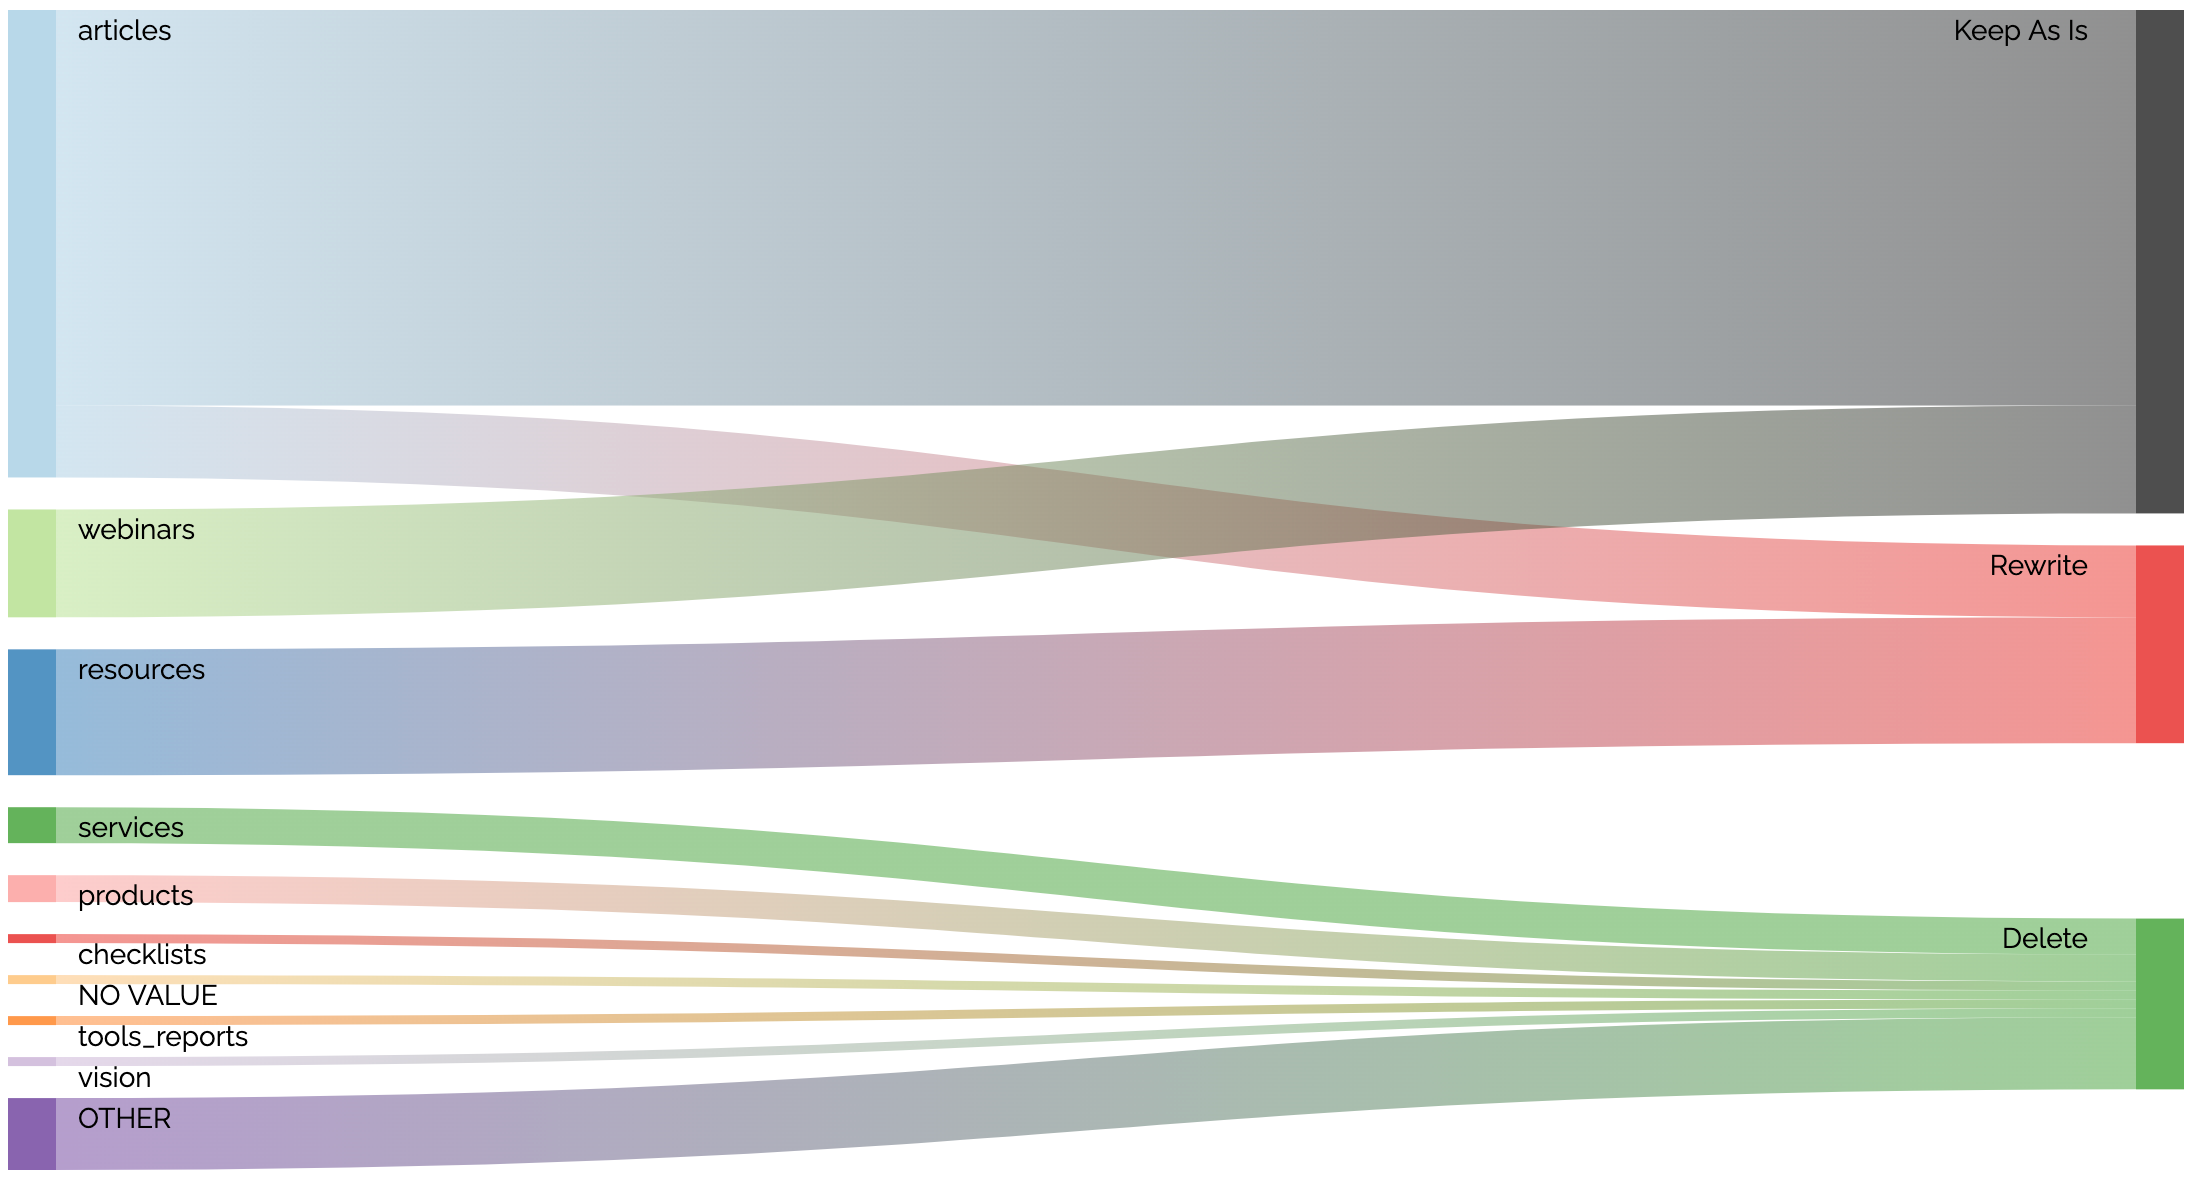
The highlight of the charting improvements are sankey diagrams and dynamic scatter charts.
Sankey diagrams visualize the flow between states. For migration planning, it can show how content will be treated. For example, in this diagram we see how content in different folders will be handled in the migration (most of the articles will be kept as is while some are rewritten, etc).
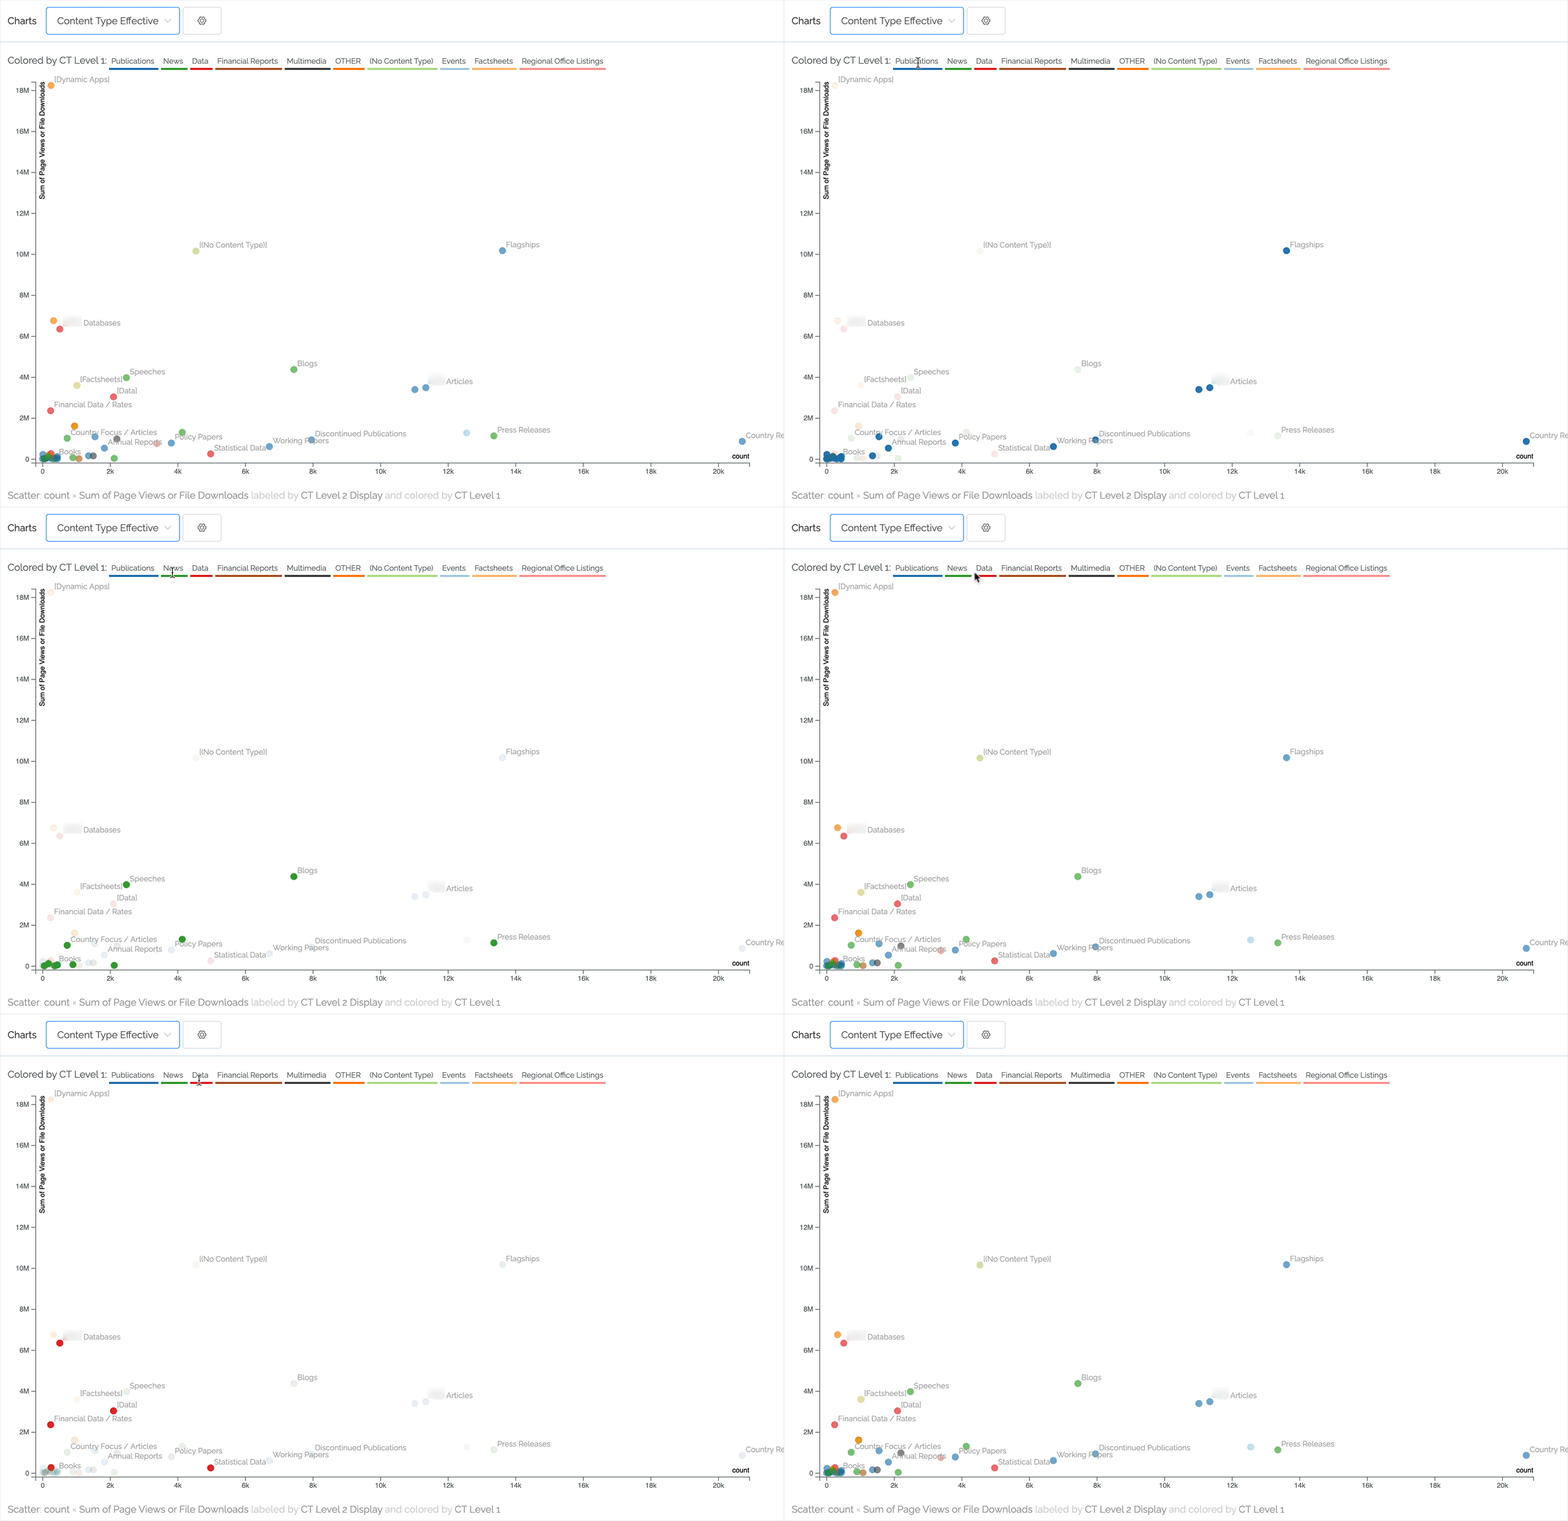
Scatter charts can pack a lot of information but always comparing two numeric values. For instance, we can plot effectiveness by comparing pageviews against number of pages. The ideal content in the chart below is toward the upper left (not many pages contributing to a lot of pageviews). In this case, the content is classified to two levels of content type, with the first level being represented by color. As you can see, by hovering over an item in the legend we highlight that primary content type.
 Other charting improvements
- As demonstrated in the above scatter chart, scales now change to show M for millions and k for thousands.
- Graphs can now be cached for better performance.
- The tool will automatically attempt to use the same colors for the same fields/values across charts.
- Better labels in treemaps.
- When there's a dramatic difference between the largest bar and any other bars in a chart, show the size in text.
- Pie charts.
Scraping and crawling improvements
Content Chimera will follow combinations of URL parameters, and you can set what parameters not to follow. That said, especially for large crawls, it can be challenging to keep restarting a crawl with different parameters. Content Chimera now automatically stops crawling unproductive paths. Related, Content Chimera will now stop following a redirect chain after going 20 deep.
27 Apr 2020: Better Scraping and Heatmap Tables
As always, a variety of routine fixes, performance improvements, and backend monitoring improvements were rolled out. In addition, many of the changes below are toward stronger features in the future. But the big headliners for now are better scraping and heatmap tables.
Heatmap Tables
Heatmap tables show compare two categories, with darkness showing the amount in each cell. For instance, this heatmap table shows how frequently different Calls-To-Action are used by site section. We can see that Change Request Flowchart is the most commonly-used CTA across the site, and that articles has the most CTAs.
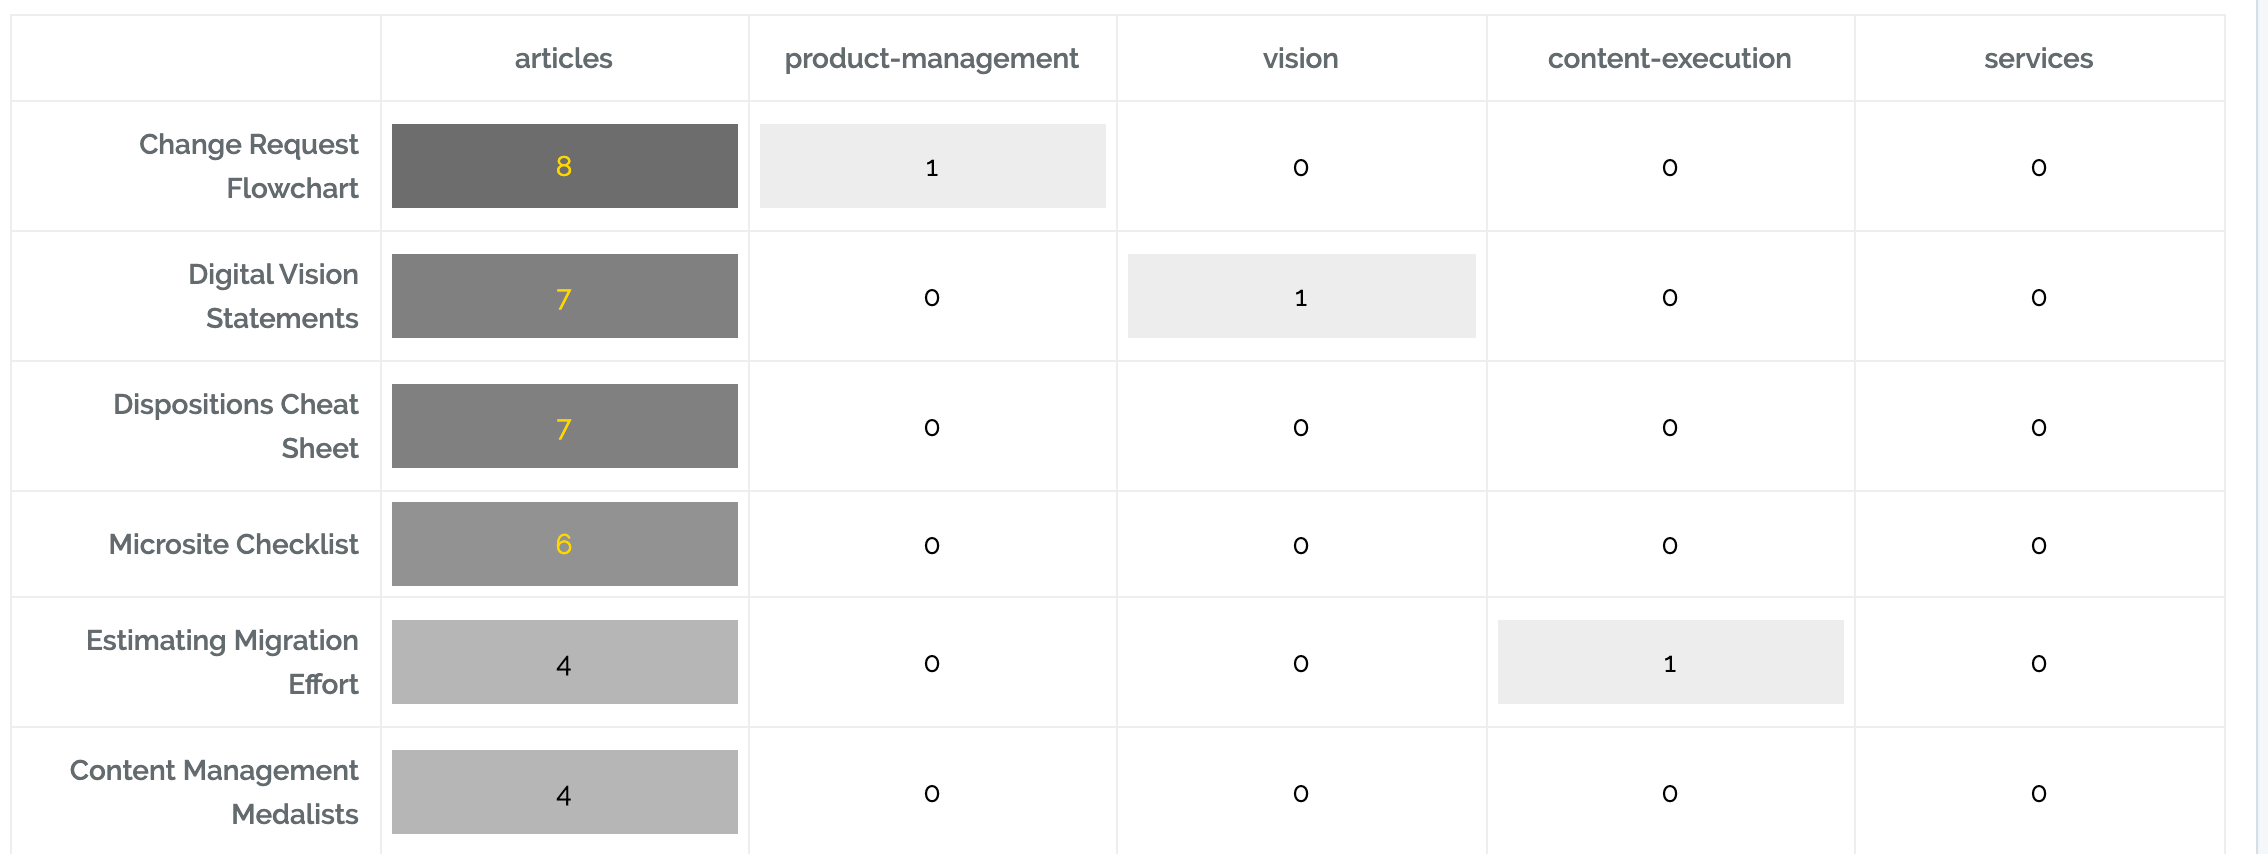
To use a heatmap table you need just need to specify what should be in the rows and what should be in the columns (after first clicking the gear icon to go to advanced charting options and the selecting Heatmap Table as the chart type):

We are also close to launching scatter charts, which is a good way to compare categories with more values.
Better Scraping of Patterns
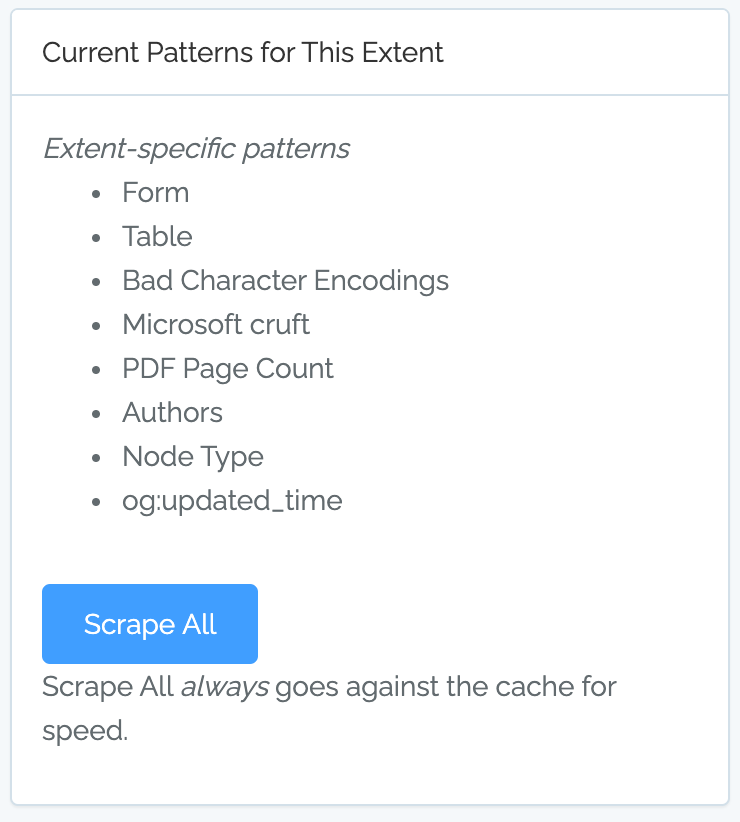
Content Chimera has always had the ability to scrape patterns out of the content, and it always did so from a local cache of the site. That said, creating, managing, and running patterns was cumbersome. So we made a variety of improvements.
Before you needed to separately select scope, pattern, and test. Now, instead of selecting "Full HTML", "Table", "Has", you just select "Tables". So you now interact with Full Patterns, which are a combination of scope (where to even look for the pattern), pattern (why to pull from the scope), and test (what single test, using a simple "does it have a value?").
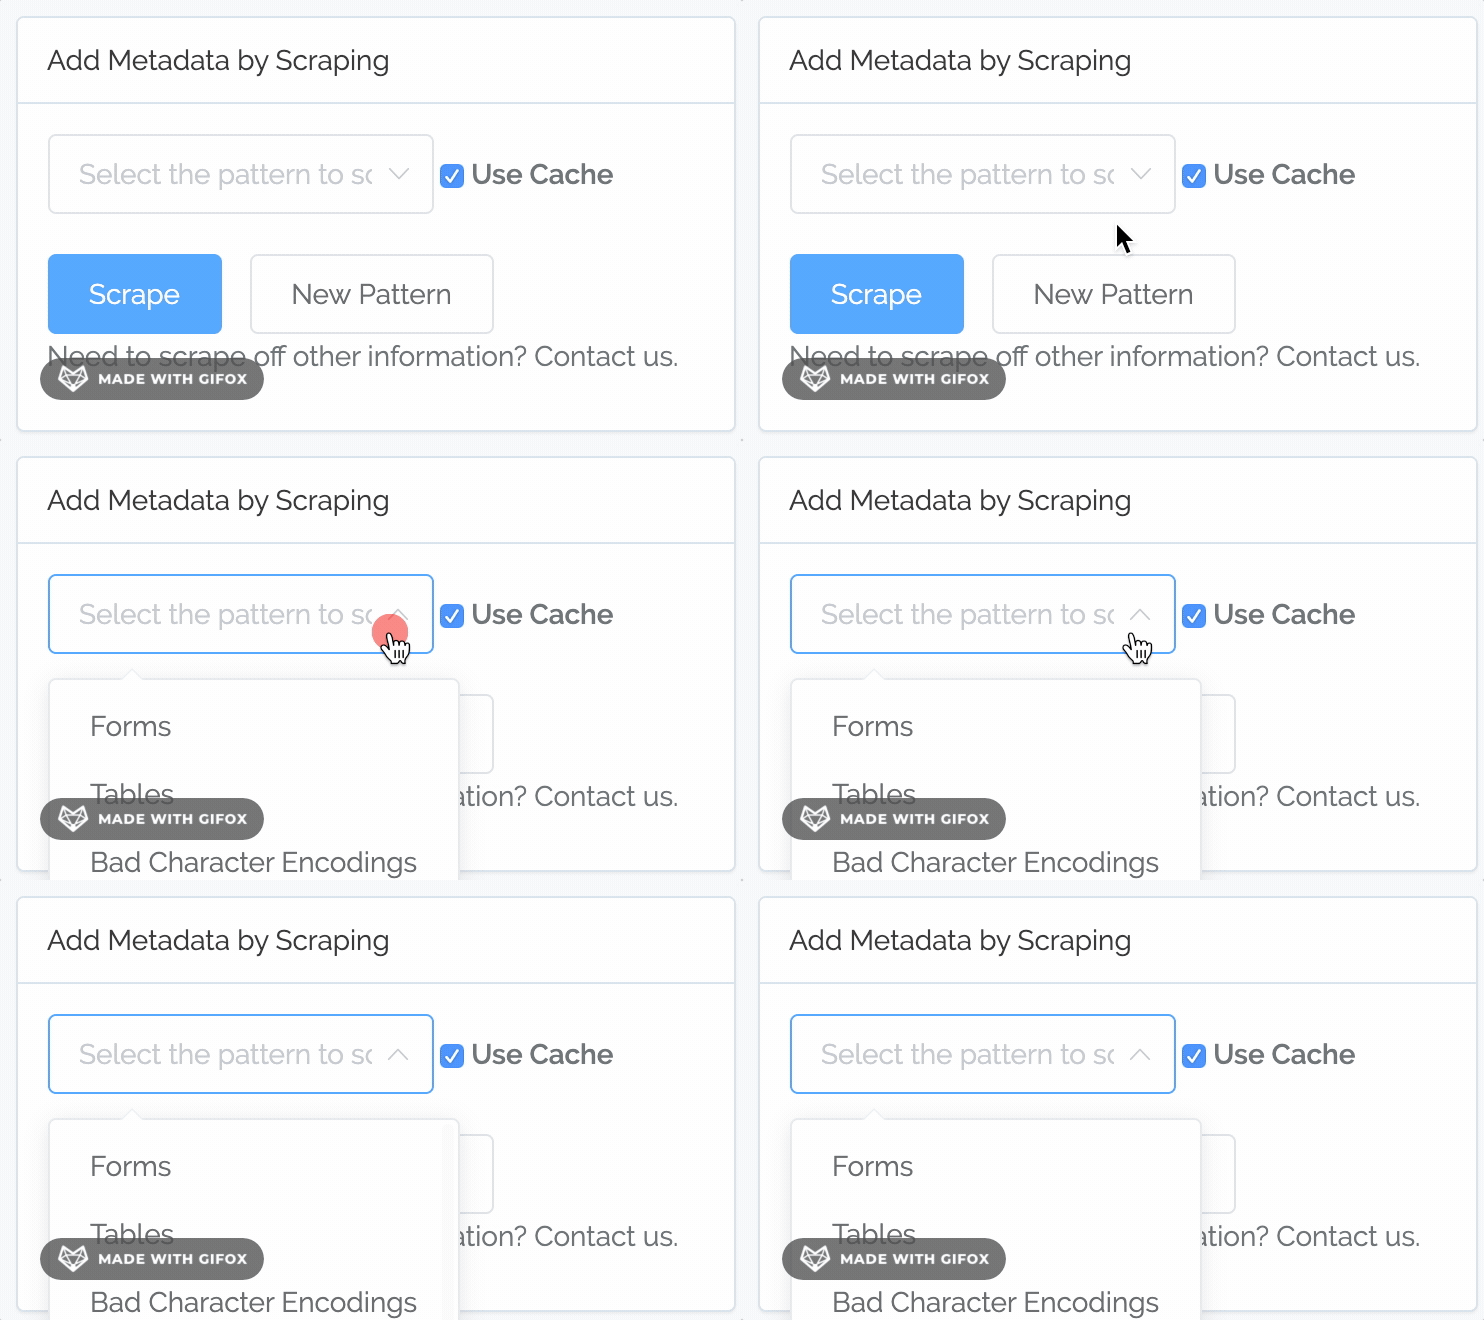
You can now define your own full patterns. You can select a combination of scope, pattern, and test, like before (although now you can name them and re-use them):
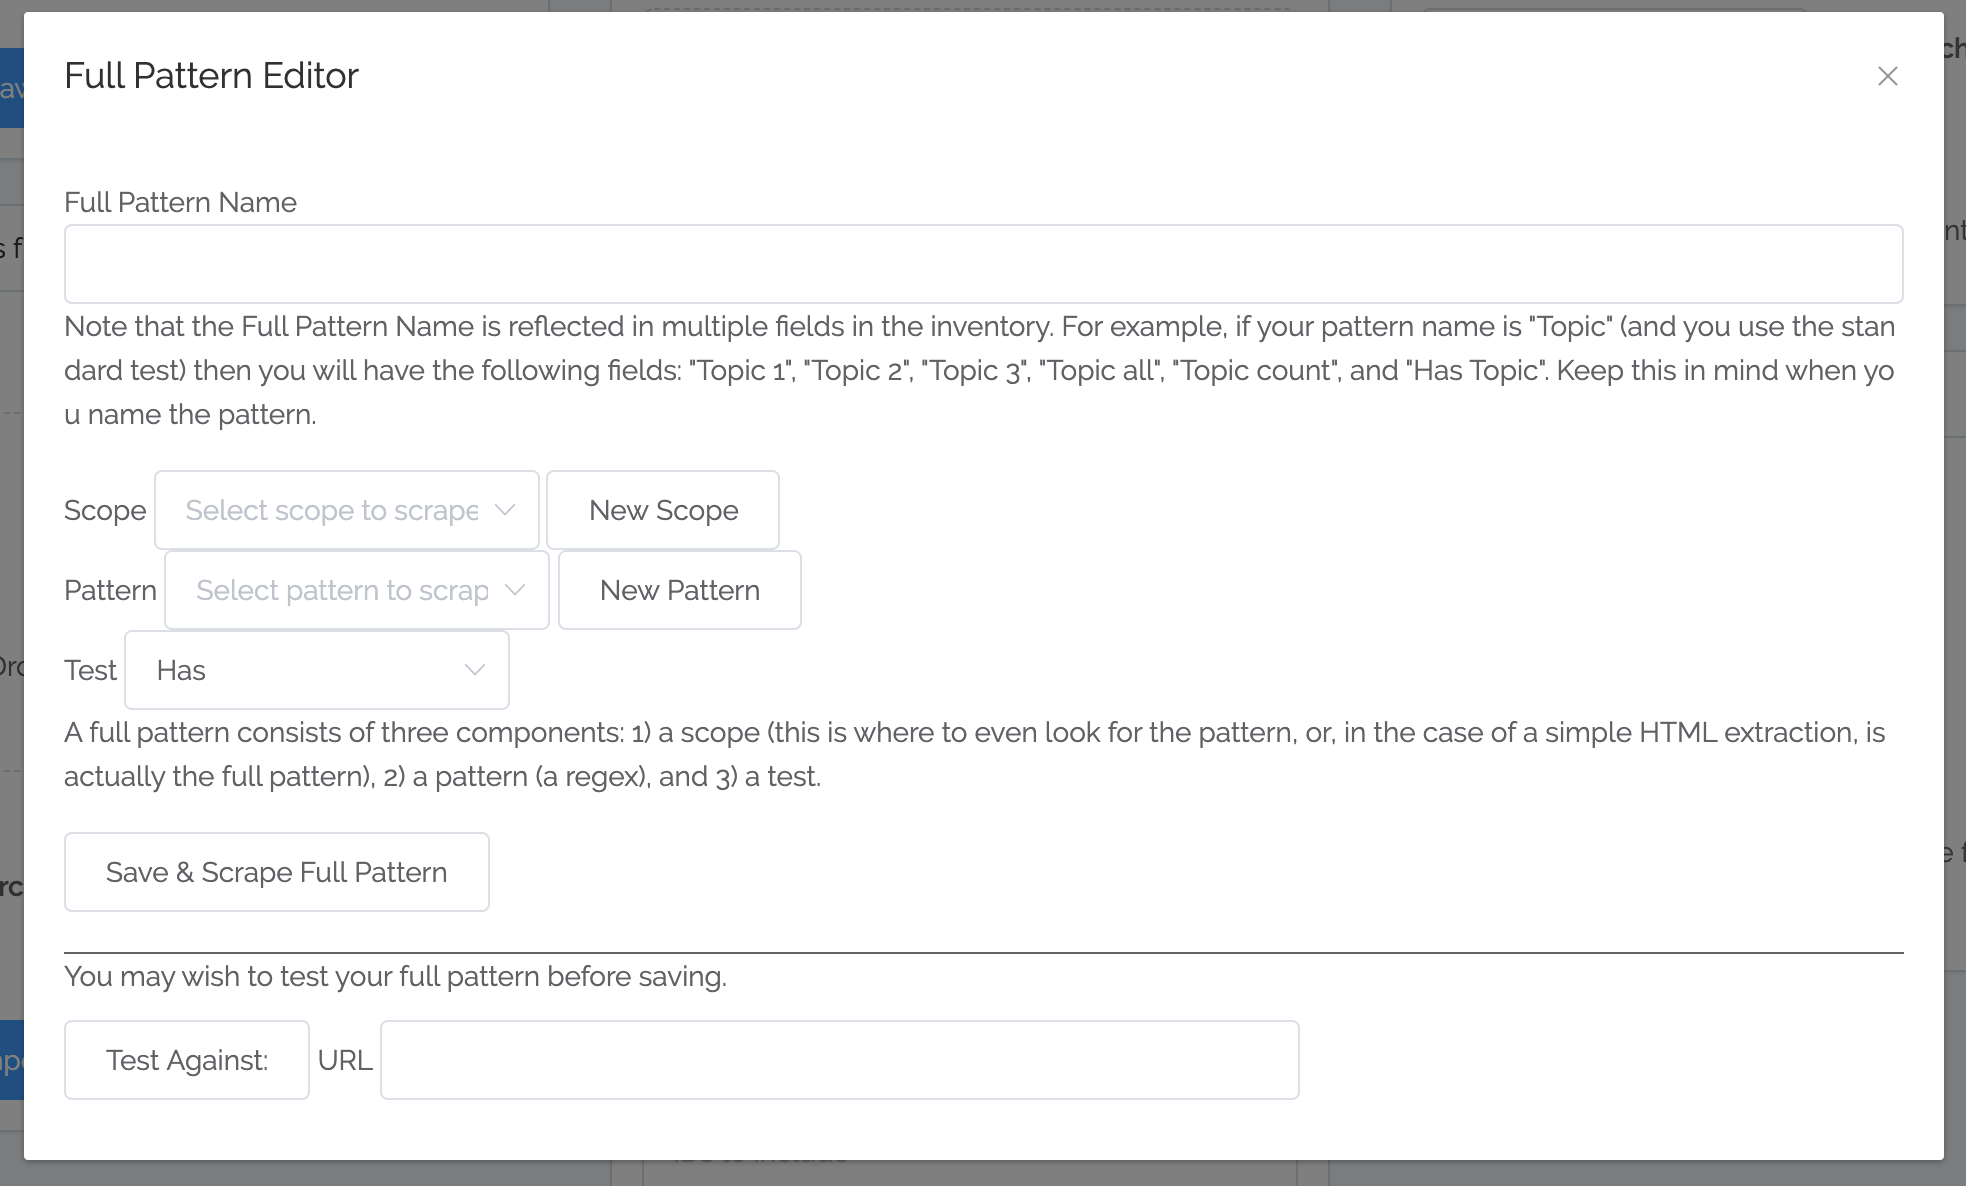
You can even define the *components* of a pattern extraction:

Do you happen to be blessed with nice, clean metadata exposed like this?

If so, when defining a scope just select the new "Meta Tag" option and just enter DC.subject or the specific meta-tag you want to capture. For pattern, select either All (which would work in the example here) or Comma-Separated (which will pull out from comma-separated lists).
You can now test a pattern before unleashing it against the entire site. For example, here is a test against the content above, using a Meta Tag scope on DC.subject:
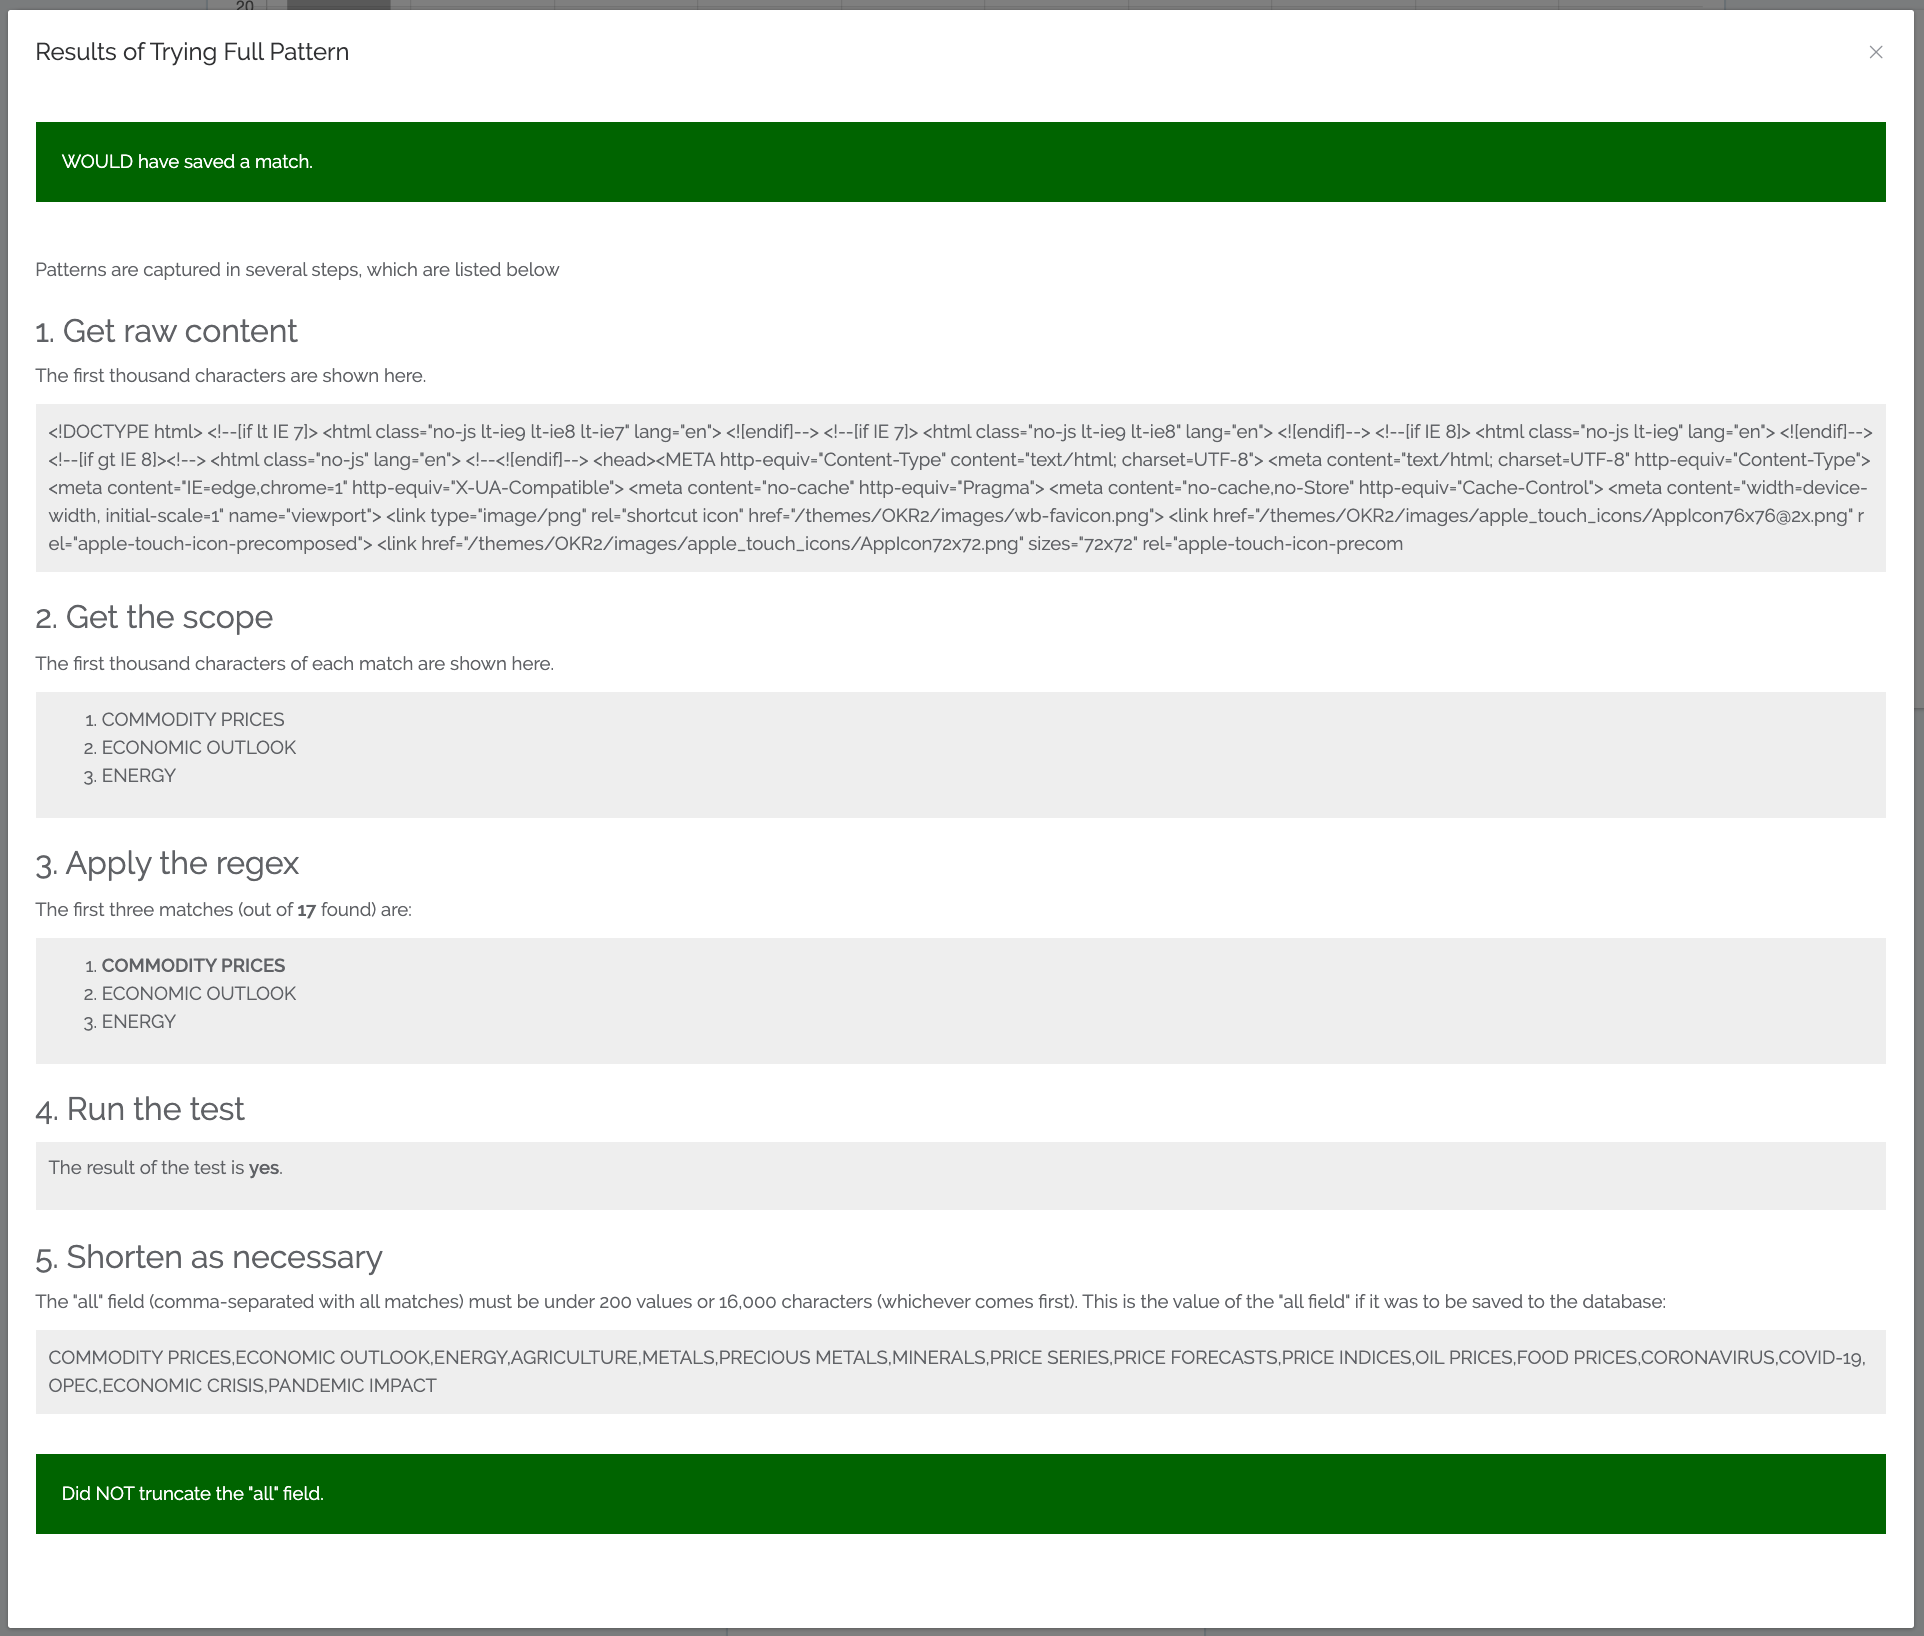
Whenever you scrape a pattern, several columns are generated for your charting and decision-making. Now we added an "all" column. This will list all the values (actually, there are limits: it just captures the first 200 values or 16,000 characters, whichever comes first). We actually are actively testing sophisticated multi-value analysis as well, which will really ramp up the value of the "all" columns.
Every time you scrape a pattern, it gets added to your site* suite of patterns. These could all be re-scraped at once. In the future we plan on allowing a billing organization to create a suite of patterns that can then be run against any sites that organization is managing.
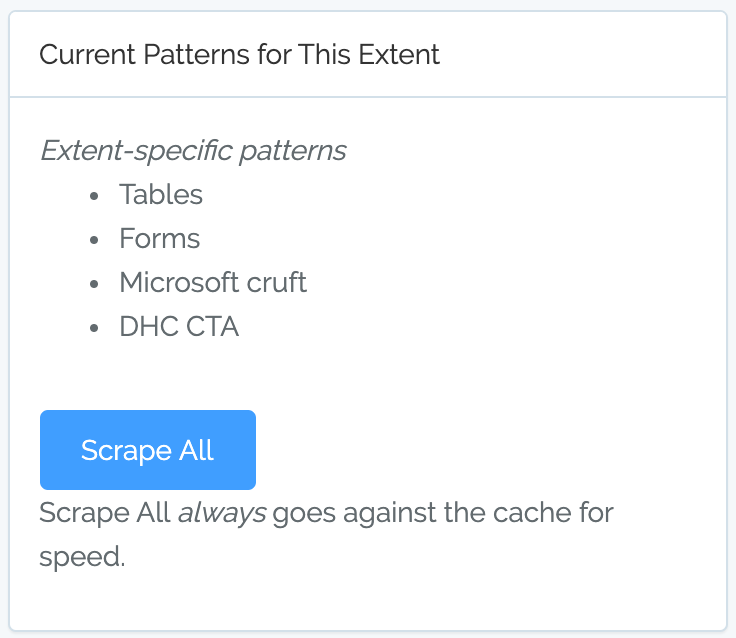
*Actually, you can add patterns to any extent. An extent is a site, group of sites, or client.
30 Mar 2020: New Forms
We have been working hard on an upcoming feature: multi-value analysis. This will allow analysis of tagging / topics for example (each piece of content can have multiple tags or topics applied to it). This is a technically-difficult task that will take some time to completely develop and deploy. For now, we have been making a variety of backend changes such as weaving in an entirely different database type for this multi-value analysis and better scraping of multi-values
Over the past weeks we have trickled out a variety of smaller changes, such as implementing a new approach logging to allow better visibility and fixing a bug where a second pass of a pattern scrape wasn't updating correctly.
We have developed a new approach for more quickly deploying new forms to control more in Content Chimera (not glamorous but should help us in the future). For now, we have added the following forms:
- A new form to add a custom data source. Please contact us if you plan on doing this so we can help with this advanced feature.
- A new Quotas & Users form (access via the pulldown under your name) where you can add more users and see the status of your quota usage.
31 Jan 2020: Chart Improvements
Various charting improvements
Advanced charting options were reorganized for clarity and for a bit more space. The primary charting options were rationalized between normal charting and treemap charting.
In normal charting:

In treemap view (since that is a true hierarchy, and coloring works differently in a treemap):

In addition, there were some bugs in random sampling that have been fixed. Also, the charting is slightly faster now.
Website improvements
Changes to the website (not the app itself):
- A new home page
- A separate features page
- A global navigation
28 Jan 2020: Filtering Improvements
Various filtering improvements
- Saving a chart also now stores the Group setting
- Chart now refreshes every time a filter is changed on the chart page
- Change the way empty values are treated (they are no longer considered as 0 — for instance when filtering on PageViews < 1, now a page that did not match a Google Analytics row at all will not be counted in that filter)
- Can now remove a filter from a chart (without refreshing the page manually)
- “is empty” operator now available in the front end
New data source + new patterns + more
- OnPoint Auditor is now a data source for import
- New patterns and scopes for scraping: including Drupal Paragraphs, Drupal Content Types, and Meta Description
- The extent history page now displays key parameters for scrape and merge jobs, and has been formatted slightly better.
- When you ran out of URLs, Content Chimera silently stopped the crawl but it didn't tell you that on the web page. This has been fixed.
- Various backend improvements
18 Jan 2020: Site History

- Site-level activity history! Now that more people are using the tool, we are running into the case of more than one person working on analysis of a site at the same time. So now you can click on "Show History" from the Assets & Metadata to see all major activity on that site (or sitegroup or client). The history also indicates who took each action.
- CAT / CWRX Audit has been added as a data source. If you missed the news, Content Science bought Content Analysis Toolkit (CAT) so it is in the process of changing names. Regardless of the name, you can now import from the tool.
- Darker color for single-color charts. During a screenshare demo to a remote conference room, everyone yelled "We can't see the chart!", so we made the bars a darker shade of gray so it's higher contrast when a monitor isn't calibrated well (or in strong ambient light).
- More URL deduping options. Content Chimera does two types of duplication analysis: at the URL level (only looking at the URL and nothing else) and content level duplicate analysis (looking at the text itself). We already had options for whether URLs starting with www or not should be considered duplicate URLs or not, along with capitalization and http or https. We just added a configuration option of whether there's an index.html (actually index.*) at the end or not, or whether there is a slash at the end or not.
- As usual, we made a variety of backend improvements as well, for us to better monitor the health of the systems and to troubleshoot more quickly.
2 December 2019: Reading Level Analysis!
Now, when you do RoT analysis, you can also do reading analysis. Then you can use the reading level data just like all other data, for instance to graph the distribution of reading levels across the pages of your site.
Also, a bunch of scaling, performance, monitoring, and bug fixes: Fix how the rules processing UI worked. Lots of mostly-invisible changes to RoT testing (better scalability, improved monitoring, improved error handling, handling more edge cases of encoding issues).
7 November 2019: Major Changes
There were a ton of related changes that we wanted to roll out together, so today's deployment was big. One theme is more consistent asset filters (rules to filter assets by, such as folder1 = articles), which are now used in rules and charts -- this is now generalized so will probably be added elsewhere as well.
Rules management
- Now there is no left-right scrolling with large and complex rulesets
- Now select rule operators (like "equals") from a pulldown, rather than the more error-prone method of having to type them
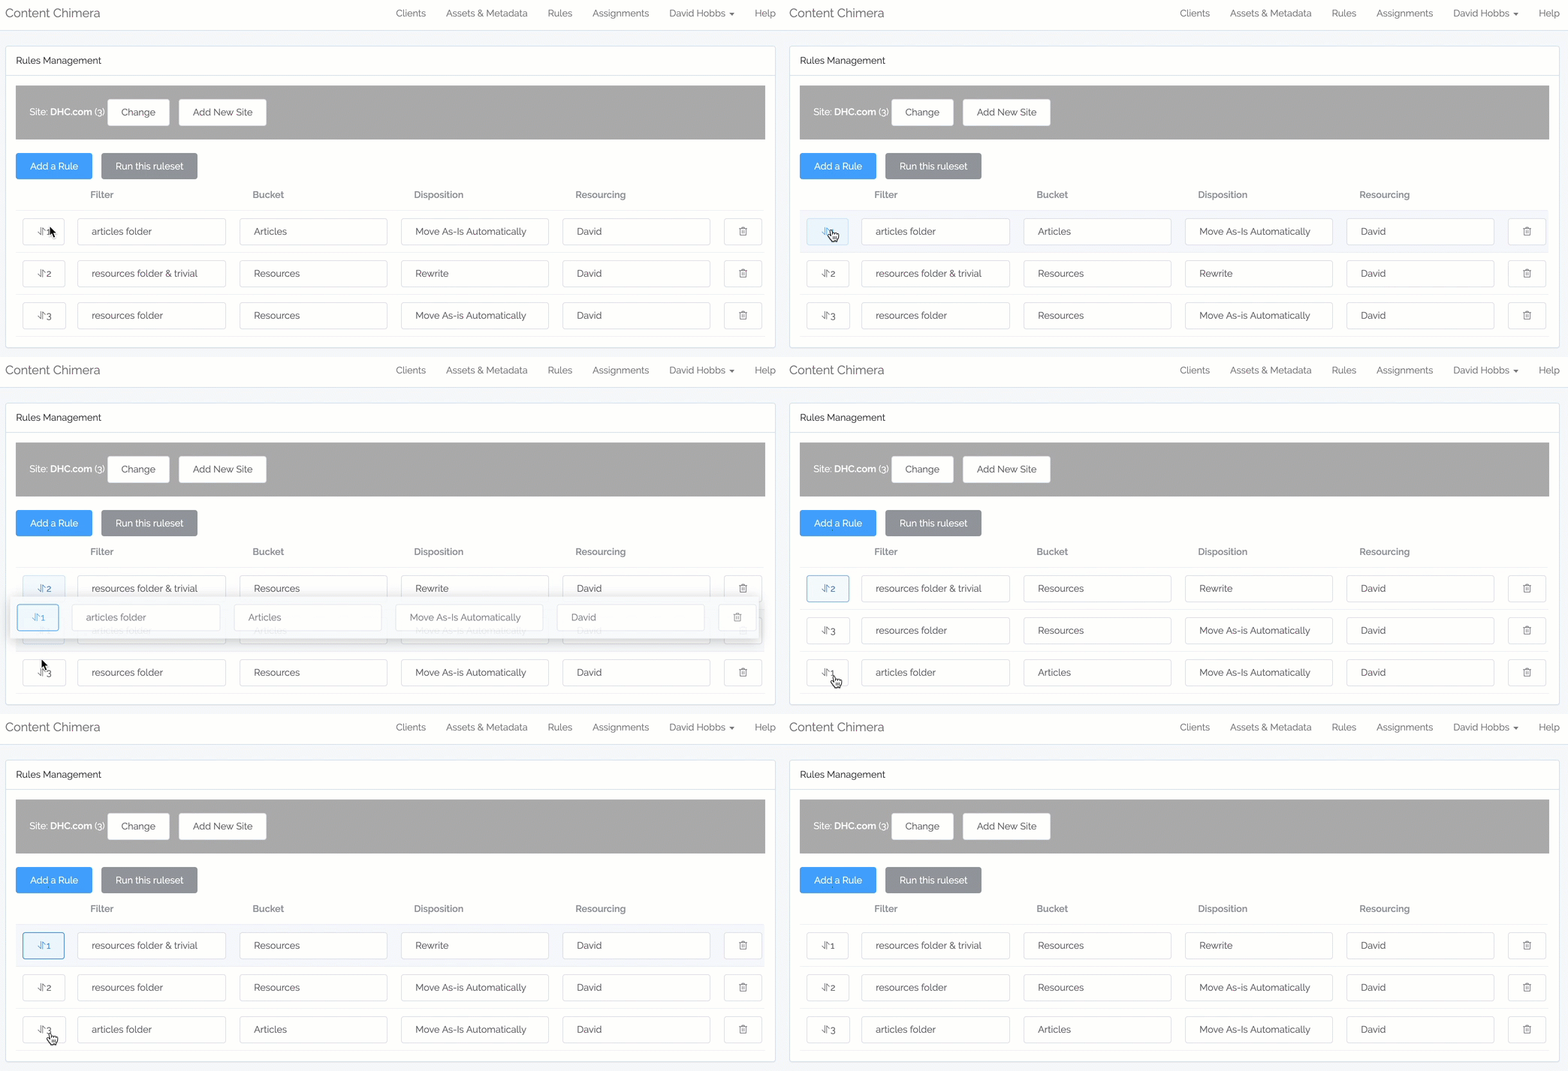
- Ability to drag-and-drop to reorder rules
Charting
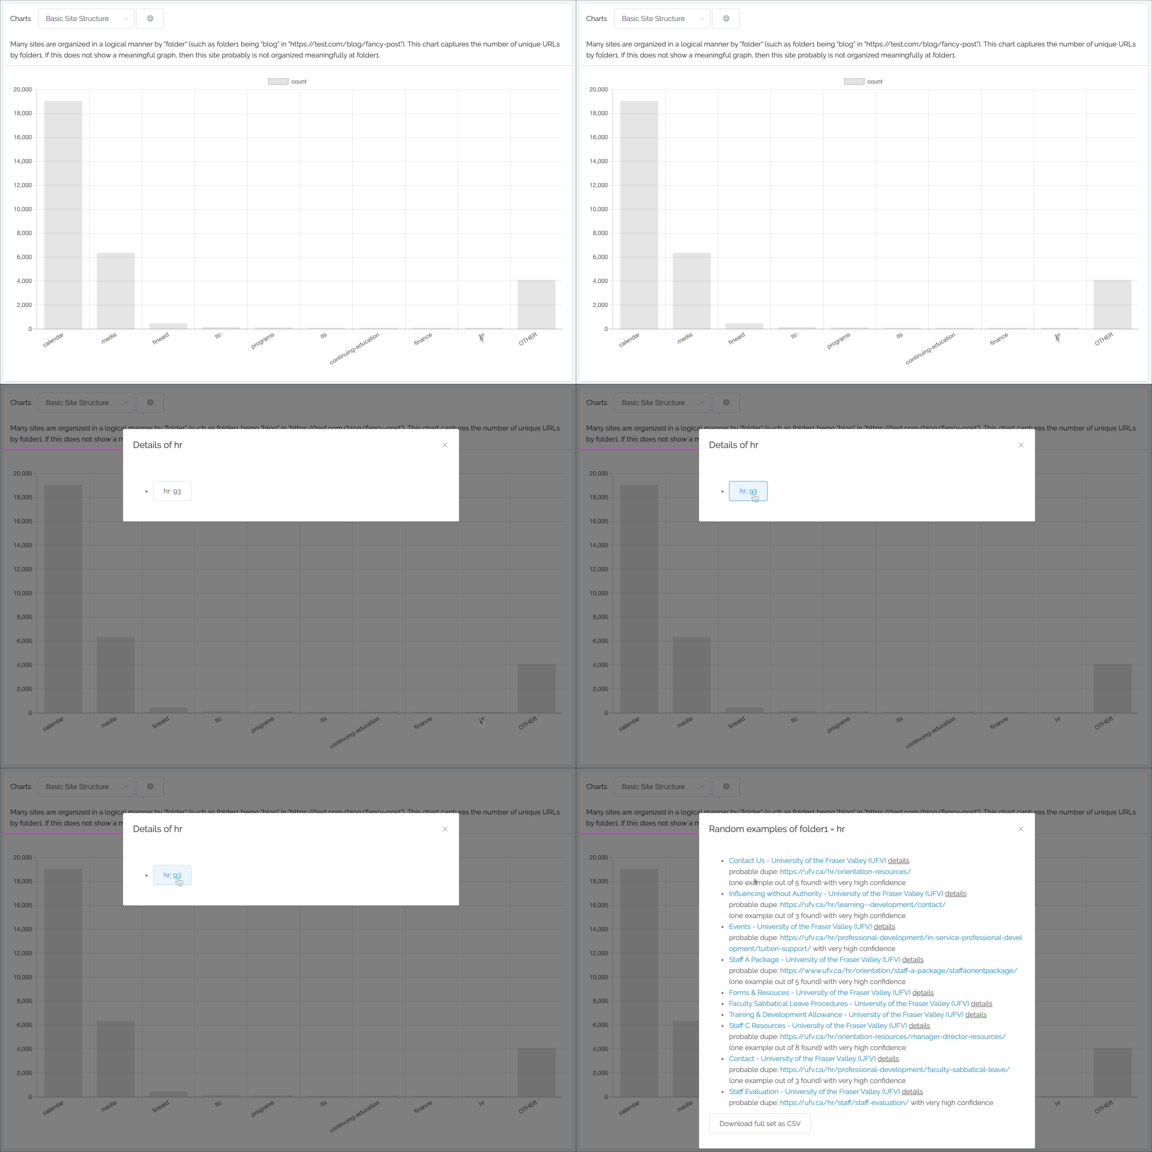
- Can now click on the label at the bottom of the graph, useful if a particular element of the graph is too tiny to click
- Filter can now be more complex (such as folder1 = article and folder2 = 2019)
UI improvements
- Can now modify clients in the UI
- Better deal with and report to the UI when there are errors
- More consistent filtering
- Make numbers better match up in progress circles
- When selecting extent (for instance, which site you want to analyze), checkboxes act as radio buttons rather than multi-selects
- In the free ROT onboarding, allow people to give their real names
- When starting a job and their are already others running jobs, report how many jobs are in front of you
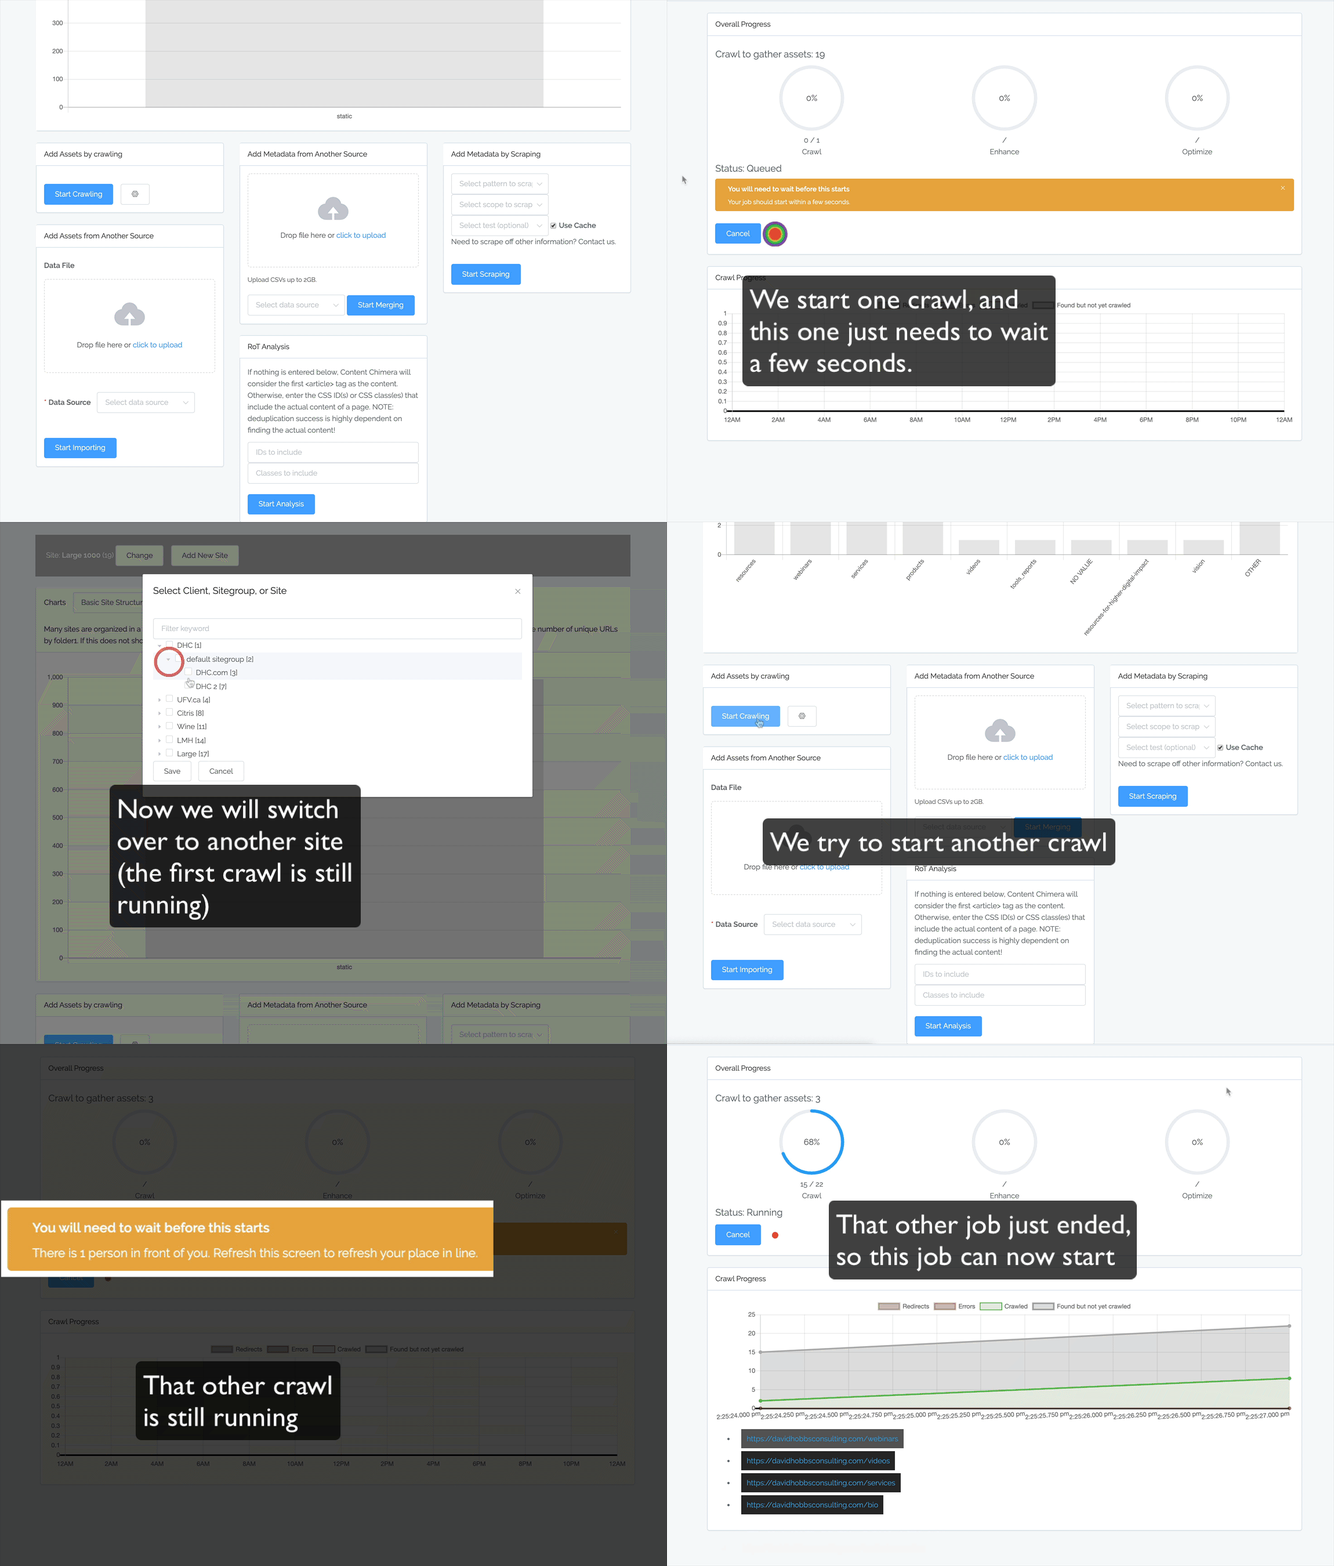
Crawling improvements
- Don't get blocked by Sucuri application filtering
- Always use Content Chimera user agent in requests
- Can now add an asset filter to a crawl job (for now this is just in the backend)
- New backend option for whether to treat www and non-www URLs as the same (whether they are treated as duplicates in the URL deduplication process)
Backend and monitoring
- Even out resource utilization across types of jobs
- Show bar at the top of environments to be clear what environment we are running (you will now see a thin red bar at the top of your screen, which indicates the main production environment
- In the event that large DB writes don't work, report this and stop the job.
- In addition to the PHP performance, server-level monitoring, logging, and alerting already in place, added more sophisticated annotations in monitoring to isolate root causes of performance issues in long-running jobs.
- Better deal with bad character encoding at the time of ROT analysis
- Better deal with emojis in text
- Take a PHP performance snapshot every half hour of a very long-running job
- Speed up file access, especially relevant for large jobs
- Better report progress on a RoT job when there is a lot of trivial content
- Fix bug when scraping against a field (rather than HTML or PDF)
-