How Content Chimera Works for Consultants
If your role is to set the stage for dramatic digital presence improvements, you may be frustrated by trying to integrate data from multiple sources to tell the story of an organization’s digital presence. It can take so much time to gather and integrate CMS data, analytics, de-duplicate URLs, establish and display content conditions. Spending too much effort on data gathering limits your ability to work at a higher level, providing the perspective that is the true value you offer to clients.
We get it. Over the years, David Hobbs Consulting hacked all sorts of one-off methods of doing this, so we sympathize.
That’s why we created Content Chimera – to help you provide unbiased advice and strategies faster and more easily.
Content Chimera is designed to enable you to scale your work by bringing together data from multiple sources and allowing you to visualize data and set rules.
Content Chimera enables you to communicate and engage with stakeholders about their digital presence, quickly answer content questions, and make smarter content decisions.
Content Chimera offers:
- Interactive charting
- A rules engine
- Merging data from sources such as Google Analytics
- Deduplicating URLs
- Multi-level analysis for complex/global digital presences
- Automated multi-step processing
- Near duplicate probabilistic analysis
- On-the-go analysis across devices
- Team support
Content Chimera imports from source systems such as CMSes or crawlers (or it can do the crawl itself, with features such as "circuit breakers" for very large crawls). See features with screenshots.
Work at another level

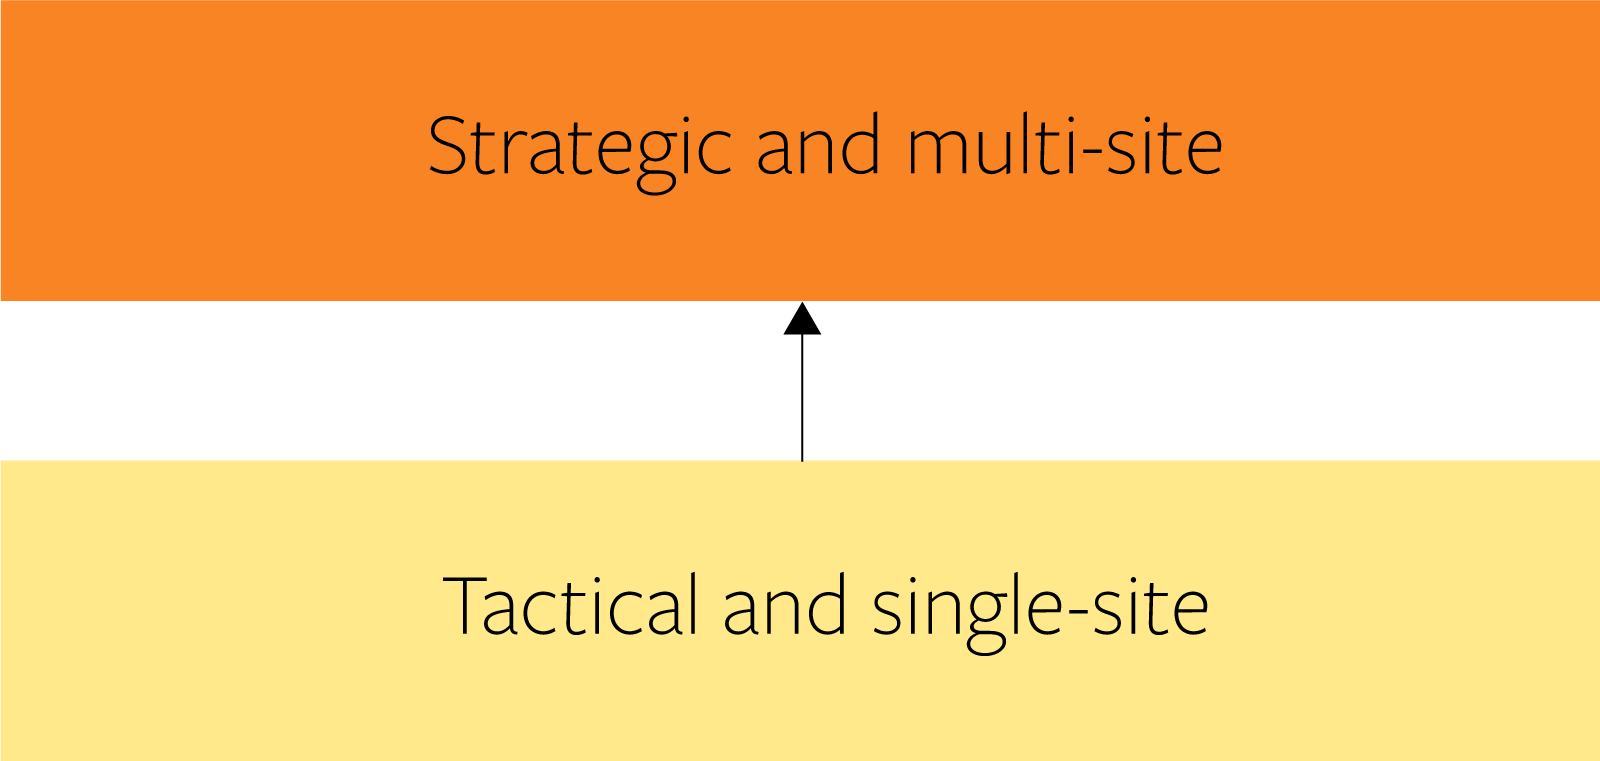
Content Chimera allows you to work at a strategic and multi-site level rather than a tactical and single-site level. It was specifically built from the ground up for multiple sites (for instance, you can analyze at the client, group of sites, or site level—see example).
| Tactical level | Strategic level |
|---|---|
| Single website | Entire digital presence |
| Content anecdotes and arbitrary observations | Test hypotheses and display data-backed visualizations of pervasiveness and distribution |
| Content owner discussions | Executive discussions |
| Spreadsheets | Interactive charts |
| Plumbing work in a table-based tool | Working on rules, decisions, and finding patterns |
More background for consultants
- Comparing against the tools you are already using. See Screaming Frog vs. Content Chimera, Time To: List, Overview, or Decision?, and ETL and BI.
- Use cases that may be useful to you. See Bigger Strategies, Content Transformation Planning, and Testing Content Hypotheses.
- Features of Content Chimera